

Your ecommerce dashboard might show record sales, but can it tell you which products are about to run out of stock? Or why an Amazon bestseller is barely moving at Walmart?
Ecommerce analytics software helps answer these questions, but not every platform tracks the same things. Some focus on website conversions and customer behavior, while others show retail sales, inventory levels, and product demand across multiple channels.
We’ve compared 15 of the best ecommerce analytics tools for 2026, covering their key features and pricing. Whether you’re running an online store or managing a CPG brand with hundreds of retail partners, this guide will help you find a platform that gives you the data you actually need.
TL;DR
| Best for | Standout feature | |
|---|---|---|
| 1. Alloy.ai | CPG brands tracking retail sales, inventory, and consumer demand across multiple channels | Phantom inventory detection and lost sales analysis |
| 2. Google Analytics 4 | Ecommerce businesses tracking website conversions and marketing attribution | Detailed e-commerce event tracking |
| 3. Mixpanel | Online stores analyzing shopping behavior and customer retention | Custom behavioral funnel analysis |
| 4. Adobe Analytics | Enterprise retailers requiring advanced customer journey analytics | Merchandising eVars for product attribution |
| 5. wetracked.io | Shopify and WooCommerce stores improving advertising attribution accuracy | 360° Data Enrichment Engine |
| 6. Glew | Ecommerce retailers tracking profitability and customer segments | Automated Daily Snapshot reports |
| 7. Luzmo | Ecommerce software providers embedding analytics into their platforms | Customizable white-label dashboards |
| 8. Contentsquare | Online retailers identifying website usability and conversion problems | Frustration Score for detecting problematic sessions |
| 9. Zoho Analytics | Ecommerce businesses combining sales and operational reporting | Ask Zia natural language analytics |
| 10. Improvado | Large ecommerce marketing teams managing advertising data across channels | Marketing Data Governance |
| 11. Woopra | Online businesses tracking individual customer journeys and retention | Unified customer profiles across interactions |
| 12. Matomo | Privacy-conscious ecommerce businesses seeking control over customer data | Self-hosted analytics with full data ownership |
| 13. Supermetrics | Marketing teams consolidating ecommerce and advertising reports | Automated data exports to spreadsheets and BI tools |
| 14. Jimdo | Small online stores needing basic sales and website analytics | Built-in ecommerce sales reporting |
| 15. GoodData | Ecommerce marketplaces offering analytics to individual sellers | Multitenant analytics with reusable metric definitions |
Understand your sales, inventory and demand at a glance. Book a free demo of Alloy.ai today.
What is ecommerce analytics?
Ecommerce analytics is the process of collecting and analyzing data from online sales channels to understand product performance, customer behavior, and business profitability. It helps businesses see what’s selling, where customers drop off in the buying process, and what needs improvement.
For example, an ecommerce brand might use analytics to identify products with high website traffic but low conversion rates, compare sales performance across Amazon and Shopify, or determine which marketing campaigns generate the most profitable orders.
For CPG brands selling through multiple retailers, ecommerce analytics also extends to inventory availability, retailer performance, and consumer demand. These businesses need to understand what happens after products reach retailers, including whether items sell as expected, which locations run low on stock, and how inventory shortages affect revenue.
Common ecommerce analytics metrics include:
- Conversion rate: The percentage of website visitors who complete a purchase.
- Average order value (AOV): The average amount customers spend per transaction.
- Customer acquisition cost (CAC): How much a business spends to acquire a new customer.
- Customer lifetime value (CLV): The estimated revenue a customer generates throughout their relationship with a business.
- Sell-through rate: The percentage of available inventory sold during a specific period.
- Inventory turnover: How frequently products are sold and replenished.
- Return on ad spend (ROAS): The revenue generated for every dollar spent on advertising.
The purpose of ecommerce analytics is to turn these metrics into decisions. That could mean adjusting ad budgets, improving product pages, replenishing inventory before stockouts, or identifying new growth opportunities.
The best ecommerce analytics tools for teams in 2026
If you want more data-driven insights to guide your ecommerce decisions, here are some of the best tools on the market today.
1. Alloy.ai
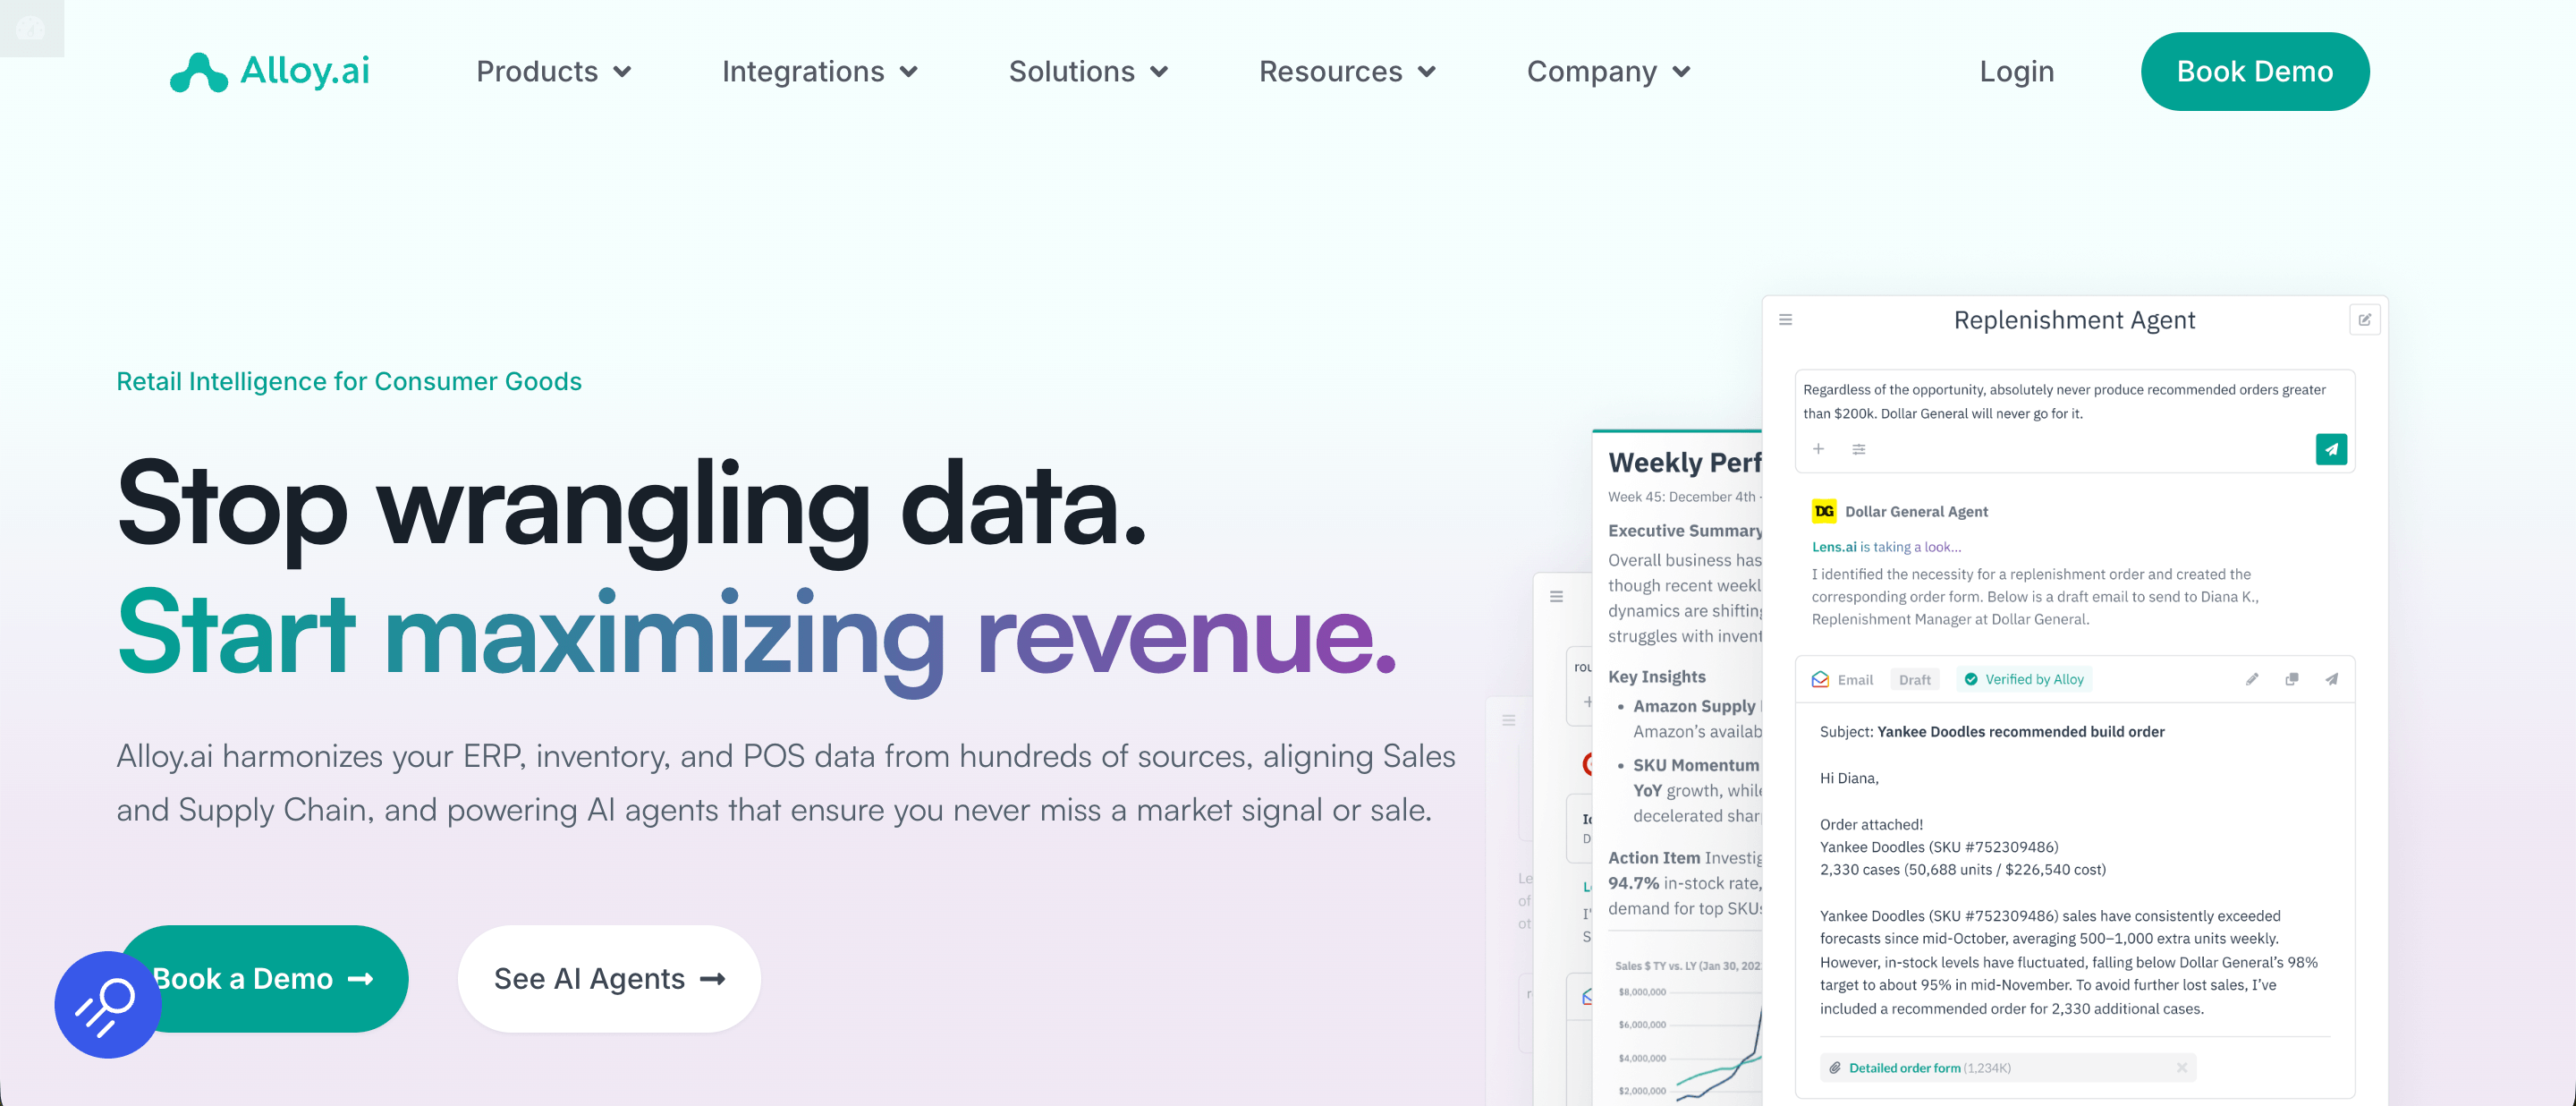
Alloy.ai is an ecommerce and retail analytics platform built for consumer goods brands that sell across multiple channels. We bring together sales, inventory, and supply chain data from hundreds of retail partners, giving brands a clear picture of product performance across Amazon, Shopify, Walmart, and other retailers. Beyond reporting, we help teams forecast demand, identify lost sales, and prevent inventory shortages before they affect revenue.
Key features:
- 450+ data integrations: Automatically collect and standardize sales and inventory data from Amazon Vendor Central, Amazon Seller Central, Shopify, retailer portals, distributors, and internal ERP systems.
- Cross-retailer sales analytics: Compare product performance across ecommerce channels and physical retail locations, with daily sales reporting and detailed analysis down to individual SKUs and stores.
- Lost sales analysis: Calculate estimated revenue lost to stockouts and identify the specific products and locations where inventory shortages are affecting sales.
- Phantom inventory detection: Identify products retailers report as available but that have stopped selling, helping teams investigate potential inventory inaccuracies and shelf-availability issues.
- Demand forecasting: Generate forecasts using actual consumer sales data rather than relying exclusively on shipment history, with predictions available at the SKU and location level.
- AI replenishment agent: Detect upcoming stockouts and prepare recovery orders for approval, helping teams address inventory shortages before products become unavailable.
- Retail performance reporting: Track sell-through against sales targets, evaluate promotional performance, and use automated reporting to investigate demand changes across retail partners.
Pricing: Alloy.ai offers custom pricing based on your business requirements and the scope of your retail operations.
Contact our team to request a personalized quote and book a demo.
2. Google Analytics 4
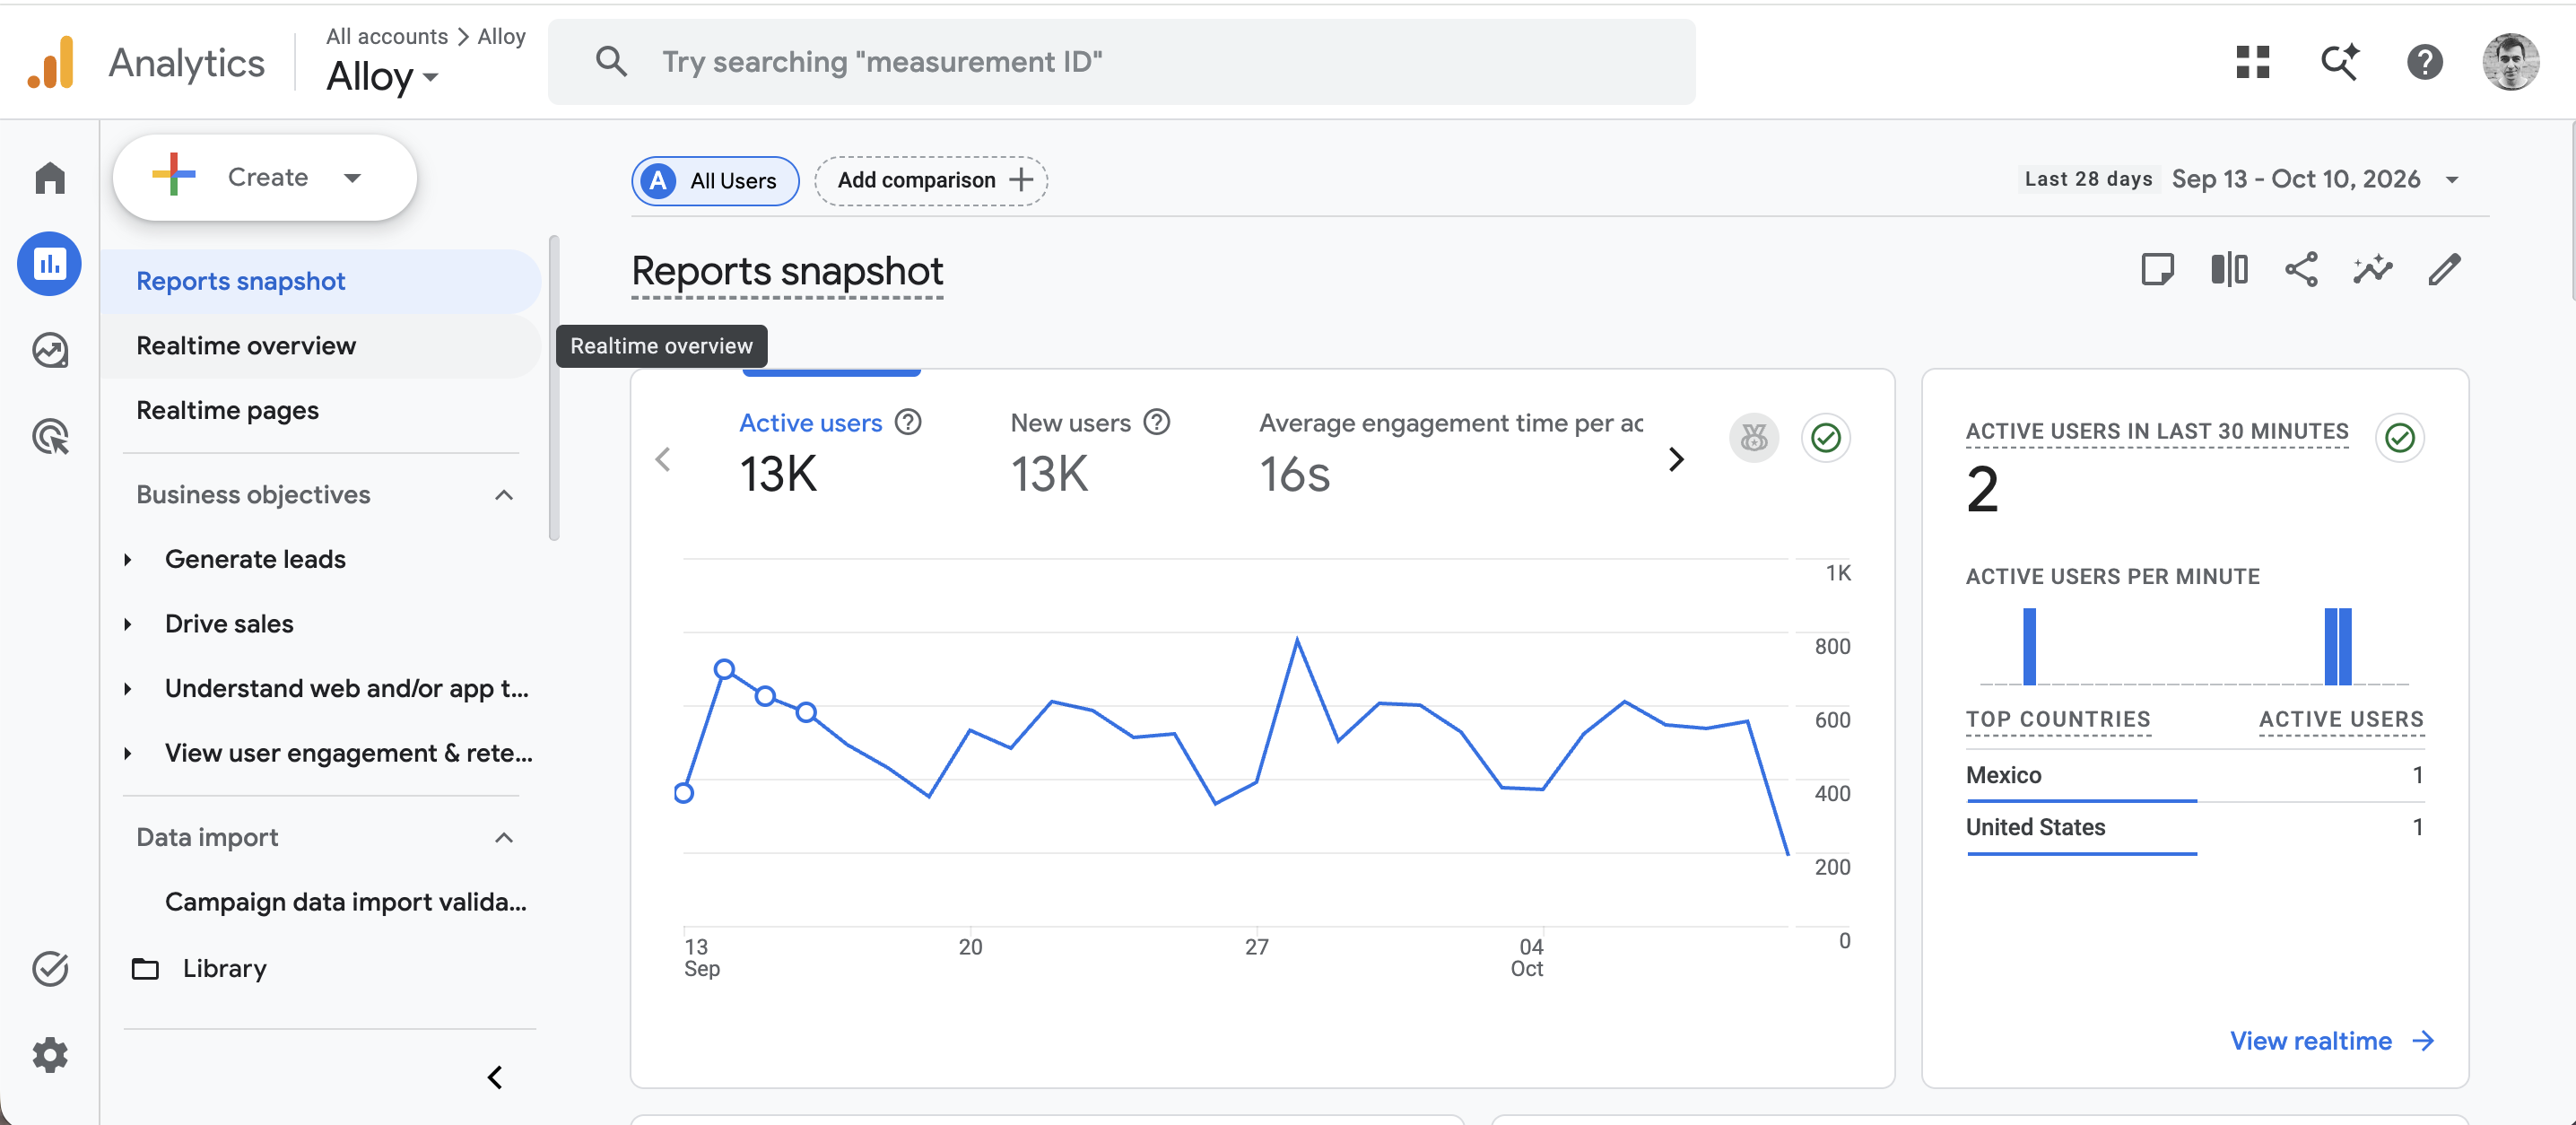
Google Analytics 4 is a free web and app analytics platform that helps ecommerce businesses understand where shoppers come from, how they interact with products, and what leads them to make a purchase. Their event-based tracking connects marketing channels to customer behavior, making it easier to spot checkout issues and identify which campaigns drive sales.
Key features:
- Ecommerce event tracking: Track specific shopping actions, including product views, add-to-cart events, checkout starts, completed purchases, and refunds.
- Checkout journey reports: Visualize how shoppers progress through checkout, including shipping information, payment details, and purchase completion, to identify where customers abandon their orders.
- Product performance reporting: Analyze individual products by items viewed, items added to cart, units purchased, and item revenue using GA4’s Ecommerce purchases report.
- Traffic acquisition and attribution: See which organic search, paid advertising, social media, and referral channels contribute to purchases, with attribution reports that show how marketing touchpoints receive conversion credit.
- Predictive audiences: Use Google’s predictive metrics to identify customers likely to purchase or stop engaging, provided your store meets the minimum data requirements.
- Google Ads integration: Share purchase events and customer audiences with Google Ads to measure campaign performance and reach shoppers who abandoned their carts.
- BigQuery integration: Export raw GA4 event data to BigQuery for custom analysis beyond the standard Analytics reports, subject to export limits and potential Google Cloud charges.
Pricing: Google Analytics 4 is free to use, while Google Analytics 360 offers custom enterprise pricing with higher data collection and reporting limits.
3. Mixpanel
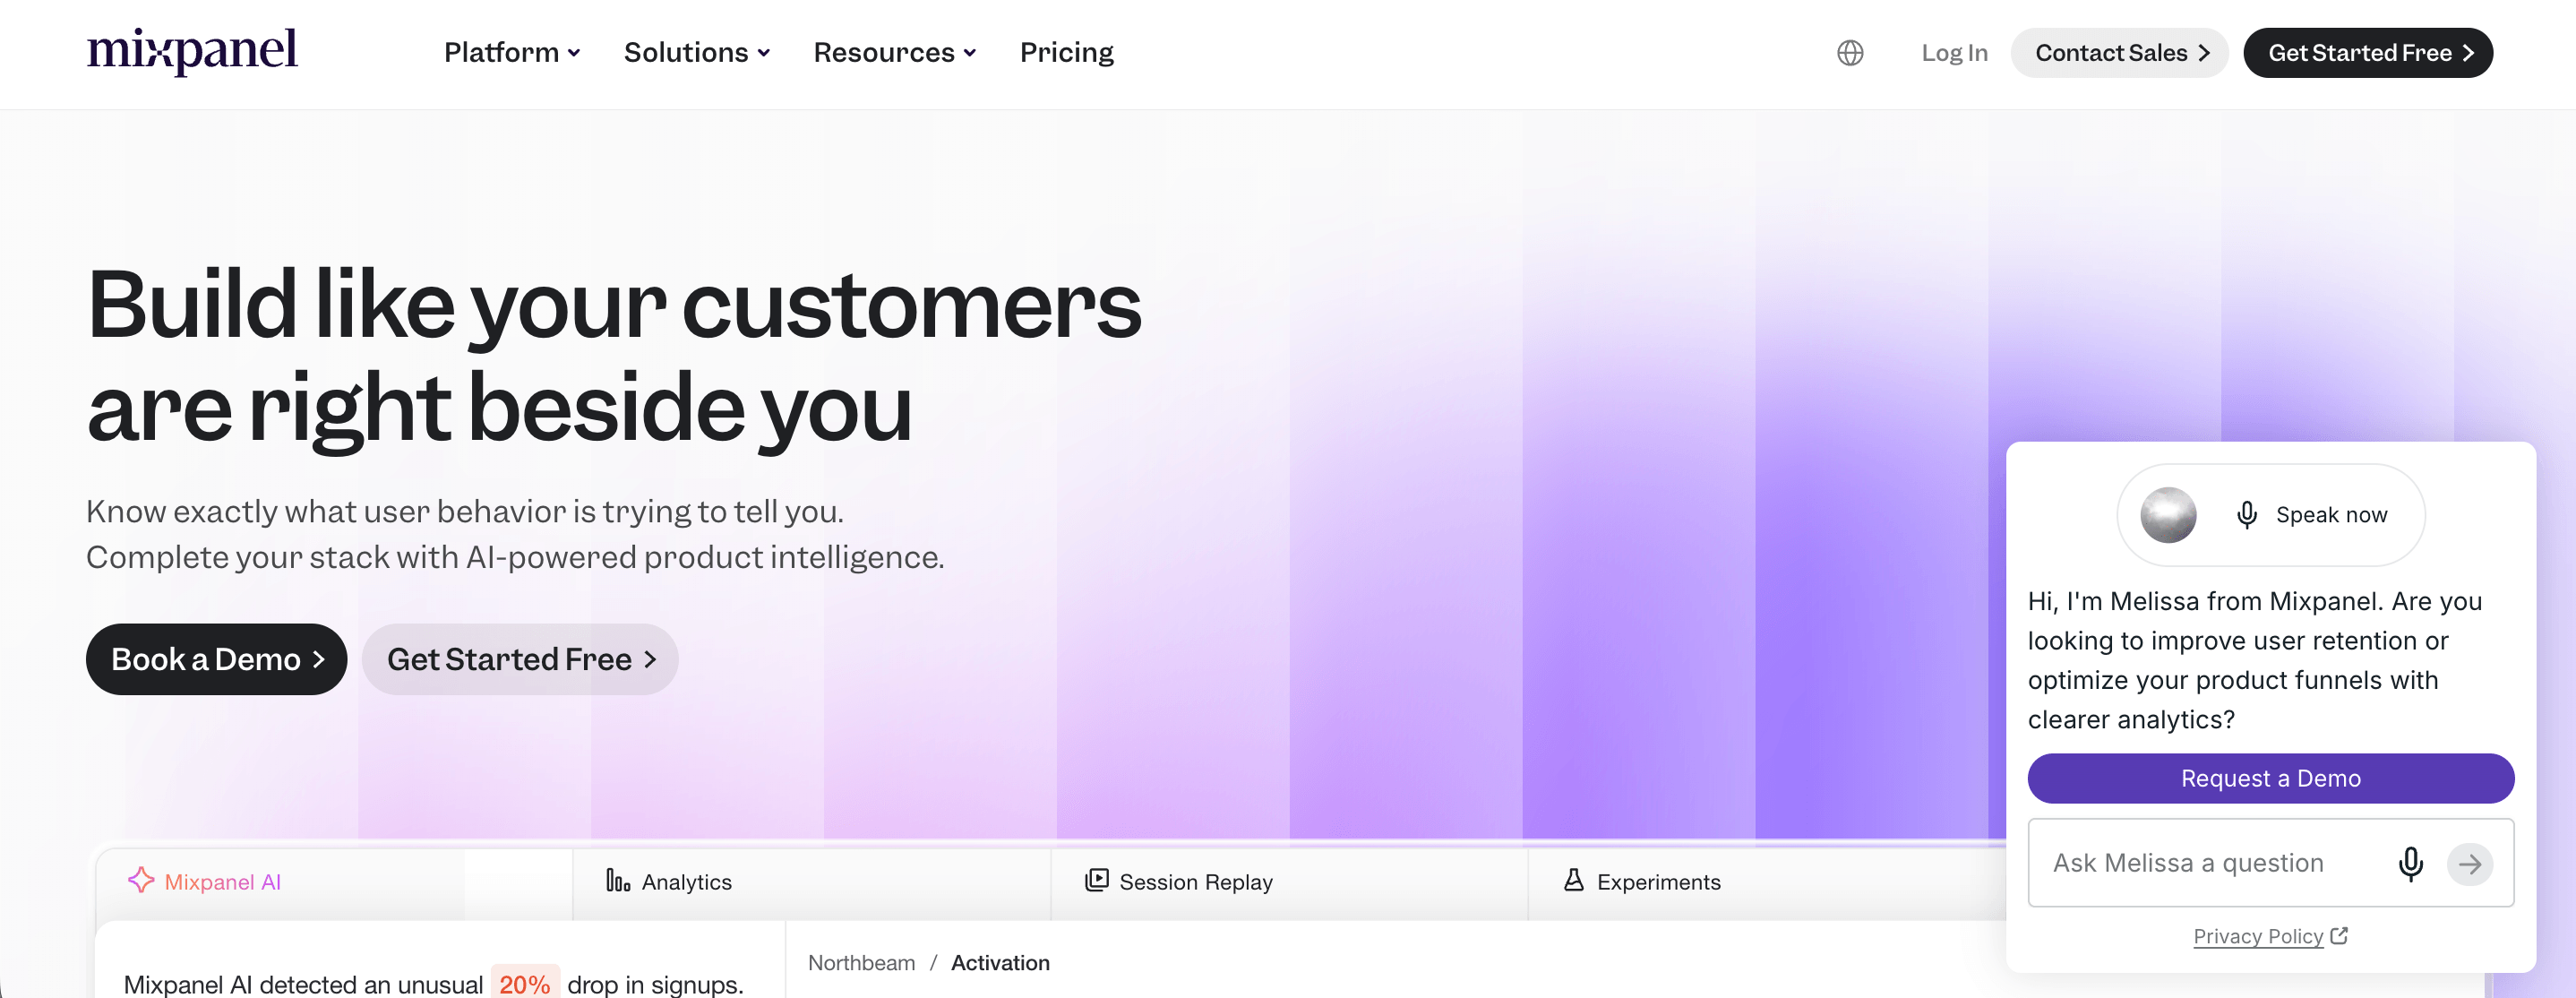
Mixpanel is a behavioral analytics platform that helps ecommerce businesses understand how customers interact with their online stores before and after making a purchase. It connects customer data across websites and mobile apps, letting teams analyze shopping behavior, identify conversion issues, and discover what drives repeat purchases.
Key features:
- Behavioral funnel analysis: Build custom funnels to track how shoppers move from product discovery to cart additions, checkout, and purchase completion, with breakdowns by device, traffic source, or customer segment.
- Retention and cohort analysis: Group customers by first purchase date, shopping frequency, or specific actions to compare repeat purchase rates and identify loyalty-driving behaviors.
- Session replay and heatmaps: Watch recordings of individual shopping sessions and review heatmaps to understand where visitors click, scroll, or run into problems on product and checkout pages.
- Mixpanel Agent: Ask questions about customer behavior in natural language and receive analysis of trends, conversion changes, and customer segments without building reports from scratch.
- Signal correlation analysis: Identify which customer actions correlate with future purchases or retention, providing behavioral insights that can inform predictive analytics models and customer segmentation.
- Shopping cart analysis: Examine cart activity and abandonment patterns to identify which customer segments leave without purchasing and where shoppers encounter friction.
- Experimentation and feature flags: Run controlled experiments on website changes, such as product page layouts or checkout experiences, and measure their impact on customer behavior and conversions.
Pricing: Mixpanel offers a free plan with up to 1 million monthly events and 10,000 session replays. The Growth plan uses event-based pricing, with the first 1 million monthly events free, while Enterprise pricing is available upon request.
4. Adobe Analytics
Adobe Analytics is an enterprise ecommerce analytics platform designed to help businesses understand customer behavior across websites and mobile apps. It combines detailed behavioral tracking with advanced segmentation and attribution tools, helping retailers turn large volumes of customer data into actionable insights. It’s particularly useful for large ecommerce operations that need more control over data collection, reporting, and analysis than basic analytics tools provide.
Key features:
- Analysis Workspace: Create custom reports using Adobe’s drag-and-drop interface, combining dimensions, metrics, and visualizations to investigate shopping behavior without writing SQL queries.
- Merchandising eVars: Attribute product purchases to specific discovery methods, including internal search terms, product categories, promotional banners, and cross-selling recommendations.
- Fallout and flow analysis: Visualize how shoppers navigate between pages and identify where they abandon the purchasing process, with the option to compare conversion paths across customer segments.
- Algorithmic attribution: Use Adobe’s statistical attribution model to distribute conversion credit across marketing touchpoints based on their estimated contribution to purchases.
- Anomaly detection and contribution analysis: Automatically identify unusual changes in sales or conversion metrics, then investigate which customer segments or traffic sources contributed to those changes.
- Adobe Target integration: Connect Adobe Analytics with Adobe Target to evaluate A/B tests using existing analytics metrics, including revenue per visitor, cart additions, and completed purchases.
- Advanced customer segmentation: Build segments using combinations of visitor attributes and behavioral conditions, such as shoppers who viewed a particular product category but did not complete a purchase.
Pricing: Adobe Analytics offers custom enterprise pricing across three packages: Select, Prime, and Ultimate. Businesses must contact Adobe for a quote based on their data requirements and selected capabilities.
5. wetracked.io
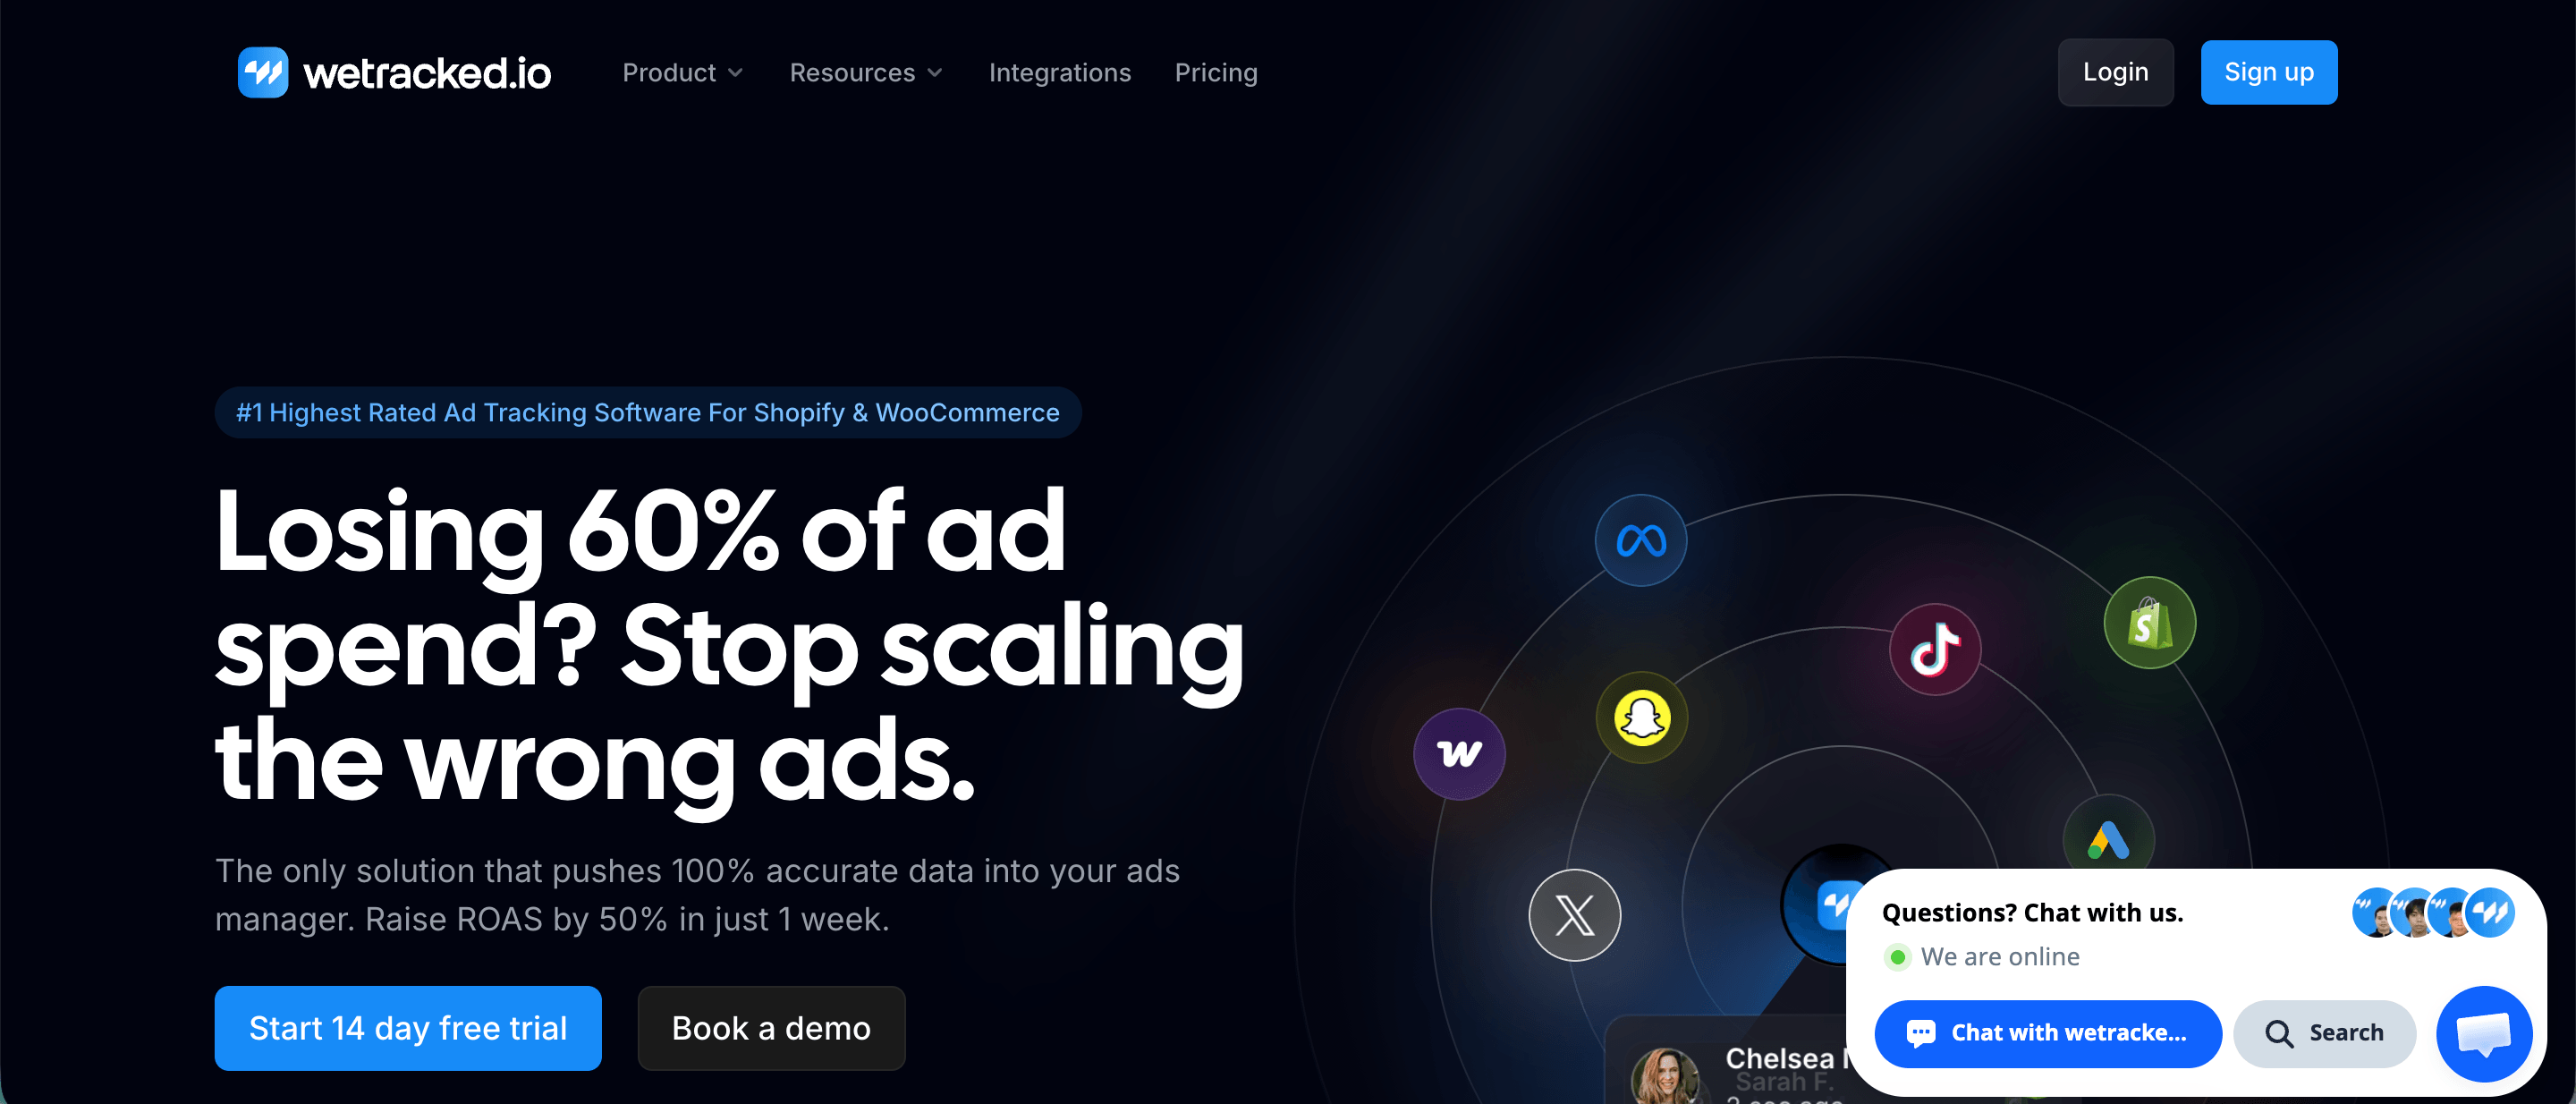
wetracked.io is an ecommerce ad tracking and attribution platform built specifically for Shopify and WooCommerce stores. It uses server-side tracking and proprietary data enrichment technology to recover conversions that traditional tracking pixels often miss because of ad blockers and browser privacy restrictions. This gives ecommerce brands valuable insights into their marketing campaigns while sending more accurate conversion data back to advertising platforms to improve their marketing efforts.
Key features:
- 360° Data Enrichment Engine: Uses 50+ data points to enrich customer events and match purchases to their originating ads, helping recover conversion data that browser restrictions would otherwise prevent advertisers from collecting.
- Server-side conversion tracking: Captures purchase events directly from Shopify and WooCommerce rather than relying exclusively on browser pixels, reducing lost conversion data caused by ad blockers and privacy restrictions.
- Direct conversion data forwarding: Automatically sends enriched purchase and revenue events to Meta, Google Ads, TikTok, Snapchat, Pinterest, and other supported advertising platforms to improve campaign reporting and optimization.
- Pulse Dashboard: Displays Meta Ads performance metrics, including return on ad spend (ROAS), cost per acquisition (CPA), attributed revenue, and top-performing campaigns, using wetracked.io’s conversion data.
- Creative Analytics: Reports on advertising creative performance, helping brands identify which ads drive purchases and which creatives deserve further investment. This feature is currently in beta.
- Unlimited ad pixels: Connect multiple advertising pixels to each store without separate pixel limits, so you can track campaigns across several advertising accounts.
- No code setup: Connect a Shopify or WooCommerce store and configure advertising platform integrations in minutes without custom development or UTM parameters.
Pricing: wetracked.io starts at $49/month for up to 500 monthly orders, with Business at $149/month and Scale up at $249/month. Annual billing offers a 20% discount, and all plans include a 14-day free trial.
6. Glew
Glew is an ecommerce analytics platform that brings together sales, marketing, inventory, and customer data from multiple stores and sales channels. It connects to over 170 applications, including Shopify, Amazon, and Google Analytics, giving retailers a centralized view of their ecommerce data. Businesses can analyze historical data, measure profitability, and track the customer journey from acquisition through repeat purchases.
Key features:
- Daily Snapshot reports: Receive an automated email every morning with the previous day’s sales, revenue, profitability, and other key performance indicators.
- 30+ customer segments: Identify VIP customers, repeat buyers, and shoppers at risk of leaving using predefined segments, with the option to create unlimited custom segments and sync audiences to Klaviyo or Mailchimp.
- RFM customer analysis: Segment shoppers by recency, frequency, and monetary value to understand purchasing habits and identify opportunities to improve customer retention.
- Contribution margin reporting: Analyze profitability across sales channels and product categories by accounting for product costs and other expenses, not just revenue.
- Product and inventory analytics: Track sell-through rates, gross margins, return rates, inventory on hand, and full-price versus discounted sales to improve purchasing decisions.
- Subscription analytics: Monitor monthly recurring revenue, subscriber churn, retention rates, and subscription profitability alongside regular e-commerce sales.
- Glew Plus custom reporting: Access a managed data warehouse with automated data pipelines and a bundled Looker license to build reports that combine information from multiple business systems.
Pricing: Glew offers two plans, Glew Pro and Glew Plus. Pro requires annual prepayment, while Plus offers custom pricing based on the required integrations and reporting capabilities. Contact Glew for a quote.
7. Luzmo
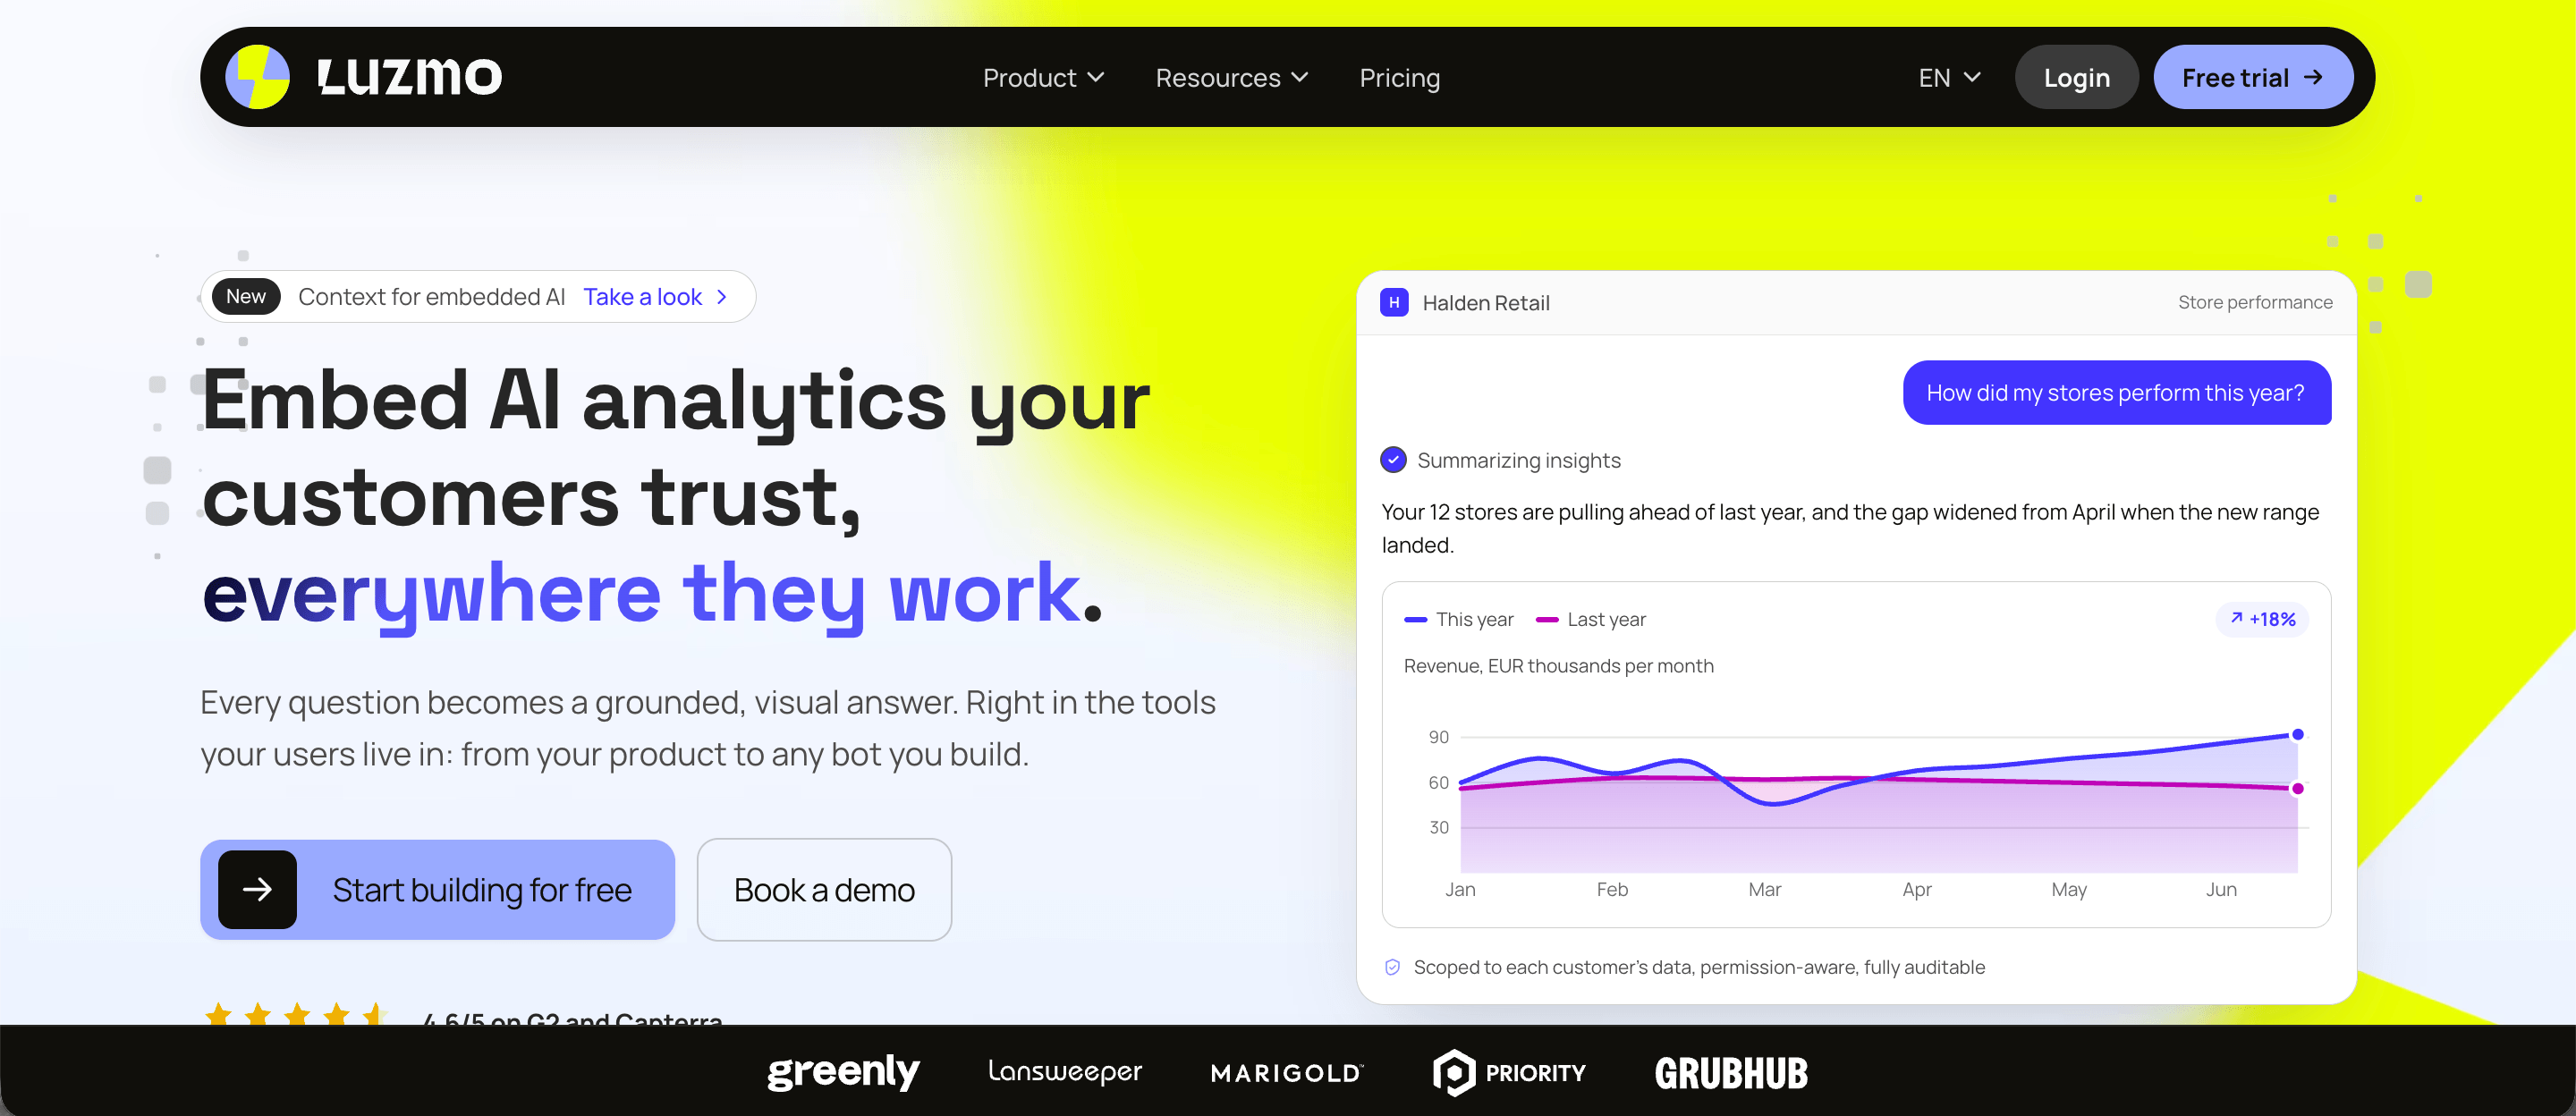
Luzmo is an embedded analytics platform that helps ecommerce software providers add interactive reporting directly to their applications. Instead of sending users to a separate analytics tool, Luzmo lets businesses create branded dashboards that turn valuable data into accessible insights on sales, inventory, and customer activity. Its flexible dashboard builder supports retail analytics use cases, from tracking marketing performance to improving inventory management.
Key features:
- Embedded ecommerce dashboards: Add interactive dashboards to existing applications to display purchase funnels, average order value, popular products, and sales trends without redirecting users to another platform.
- Retail inventory dashboard templates: Monitor warehouse availability, shipping performance, expected delivery times, and stock availability using prebuilt retail reporting templates.
- Webshop optimization dashboards: Analyze store traffic and marketing performance across acquisition channels, including social media campaigns, using customizable dashboard templates.
- Retail profitability reporting: Compare product margins and revenue across stores or product lines to identify which products contribute most to overall profitability.
- White label analytics: Customize dashboard colors, fonts, layouts, and branding to match an existing e-commerce application, including removing Luzmo branding from the user experience.
- Luzmo Studio: Build interactive dashboards with a drag-and-drop editor, allowing customers to create their own visualizations and explore data without developer assistance.
- Luzmo AI: Let users ask questions about retail performance in natural language and receive data visualizations based on their connected business data.
- Secure customer analytics: Use tenant-level permissions and data access controls to give individual merchants access to their own reports within a shared e-commerce platform.
Pricing: Luzmo starts at €1,995/month, billed annually, with white-label analytics, dashboard customization, and AI capabilities included. Pricing also scales with customer usage, and a free trial is available.
8. Contentsquare
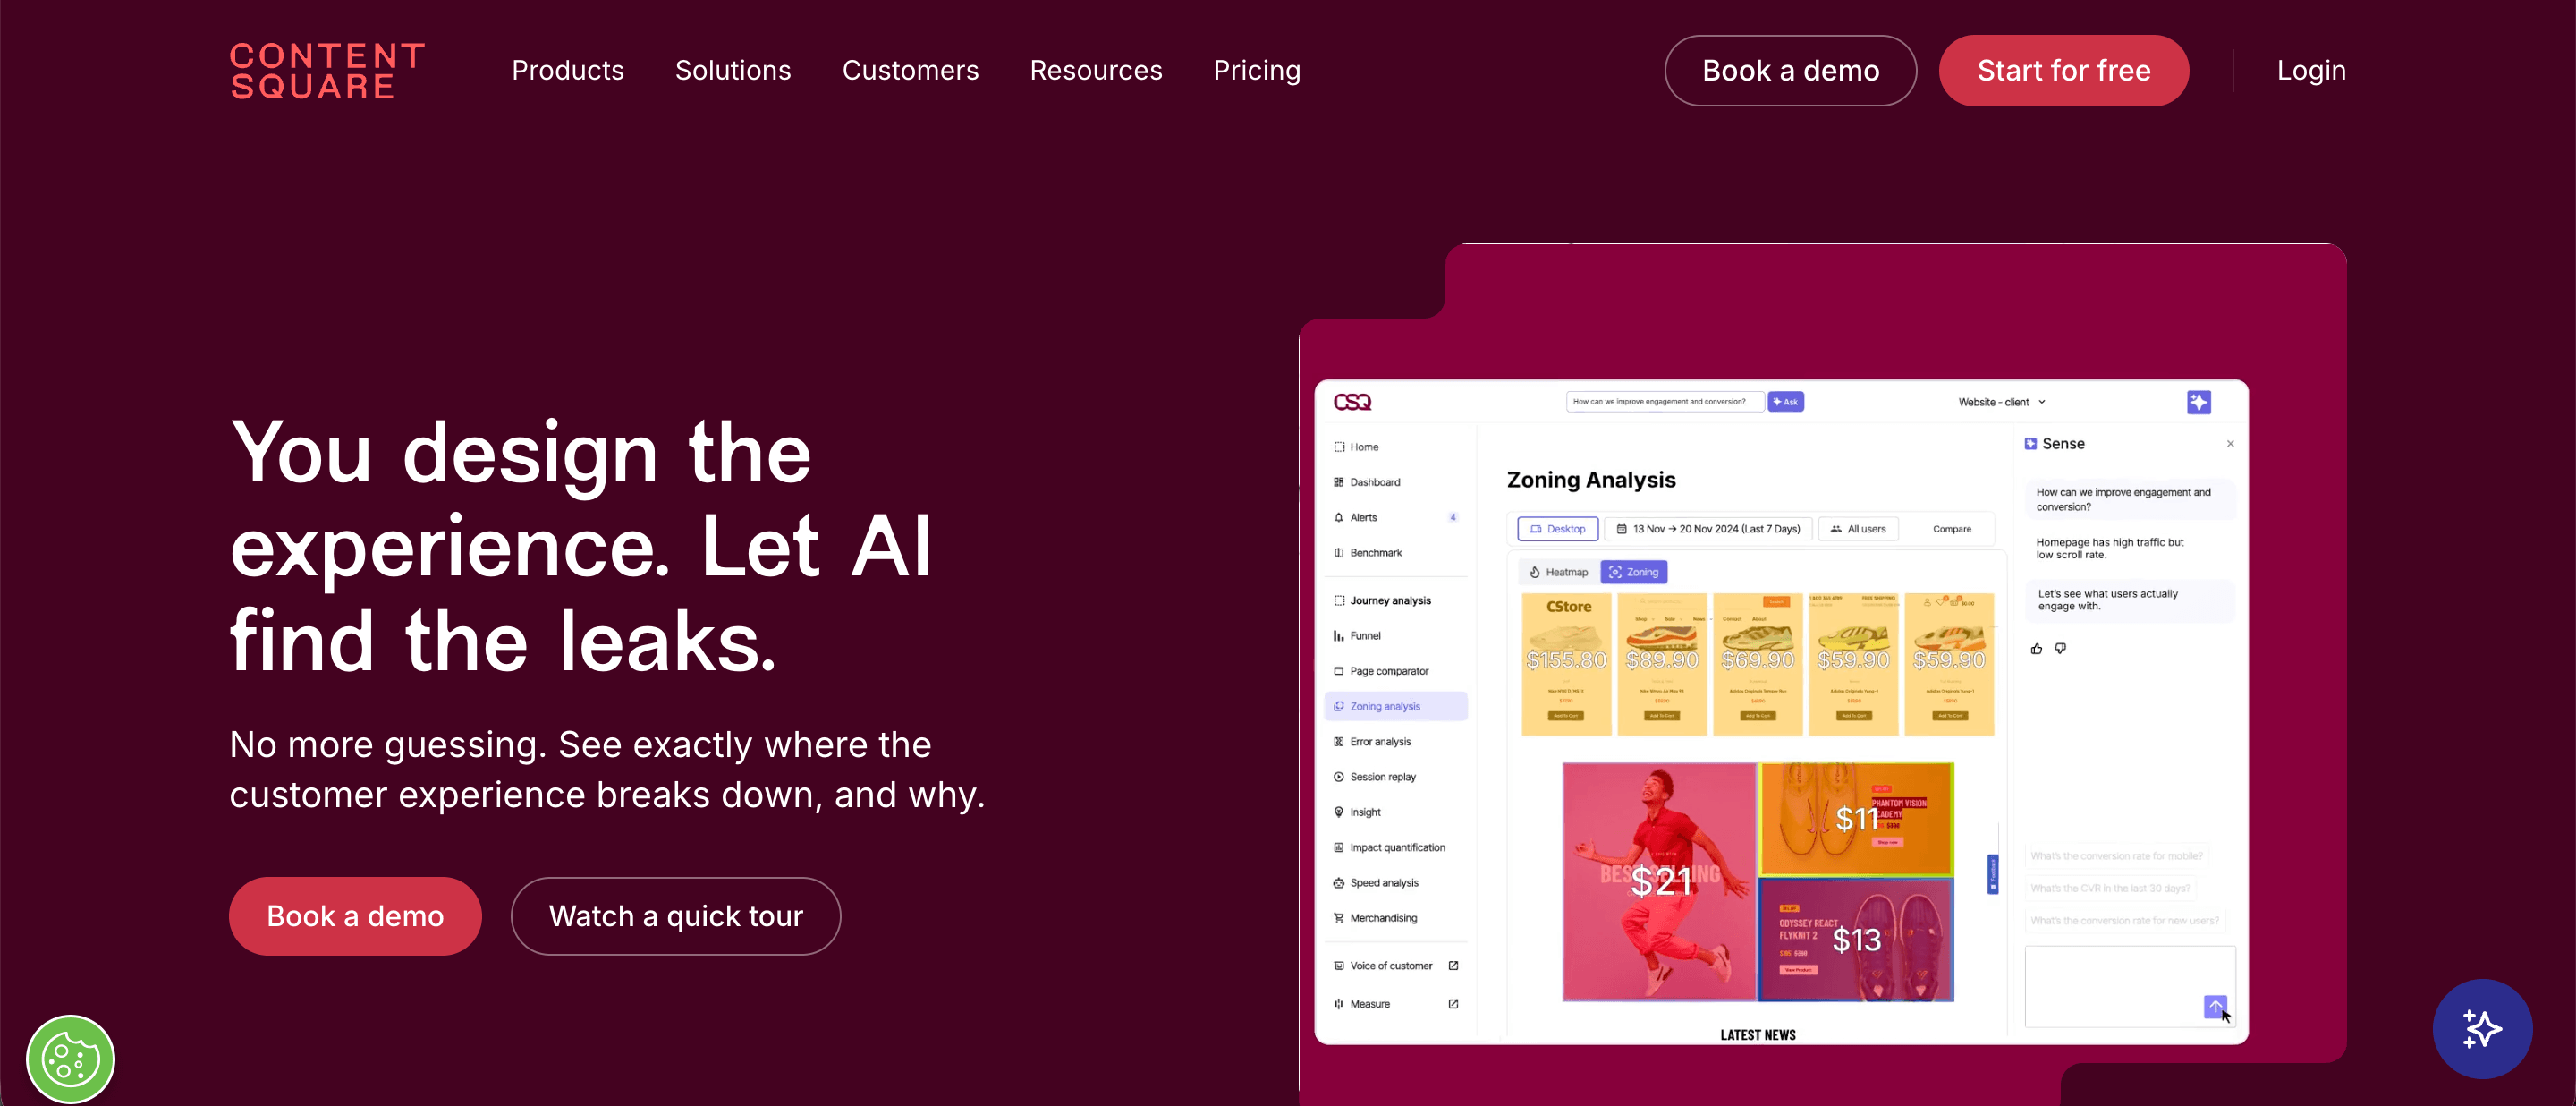
Contentsquare is a digital experience analytics platform that helps online businesses understand how shoppers interact with their websites and mobile apps. It combines descriptive analytics with behavioral insights to show why customers abandon purchases, which page elements drive conversions, and where businesses lose potential sales.
Key features:
- Zone-based heatmaps: Analyze how shoppers interact with individual elements on product pages, including images, promotional banners, and purchase buttons, with metrics for engagement, click rates, and conversions.
- Journey Analysis: Visualize the paths customers take through an e-commerce store, from their first visit to checkout, and identify unexpected navigation patterns or pages where visitors abandon their sessions.
- Frustration Score: Automatically rank customer sessions based on signs of frustration, such as repeated clicks, JavaScript errors, and form resubmissions, so teams can prioritize the most problematic shopping experiences.
- Session Replay: Watch recordings of actual shopping sessions to investigate abandoned carts, broken checkout elements, and usability problems. Sense can also generate summaries that highlight important moments.
- Impact Quantification: Estimate how specific website problems affect conversion rates and revenue, helping teams prioritize improvements based on their financial impact.
- Merchandising analytics: Analyze how shoppers interact with product listings and category pages to identify which product placements attract attention and drive purchases.
- Lifetime metrics and value segments: Examine repeat visits and purchasing behavior across multiple sessions to understand customer retention and identify opportunities to improve customer lifetime value. Available through the User Lifecycle extension on eligible plans.
Pricing: Contentsquare offers a free plan with up to 200,000 monthly sessions. Paid Experience Analytics plans start at $49/month with annual billing, while Pro and Enterprise plans require custom quotes.
9. Zoho Analytics
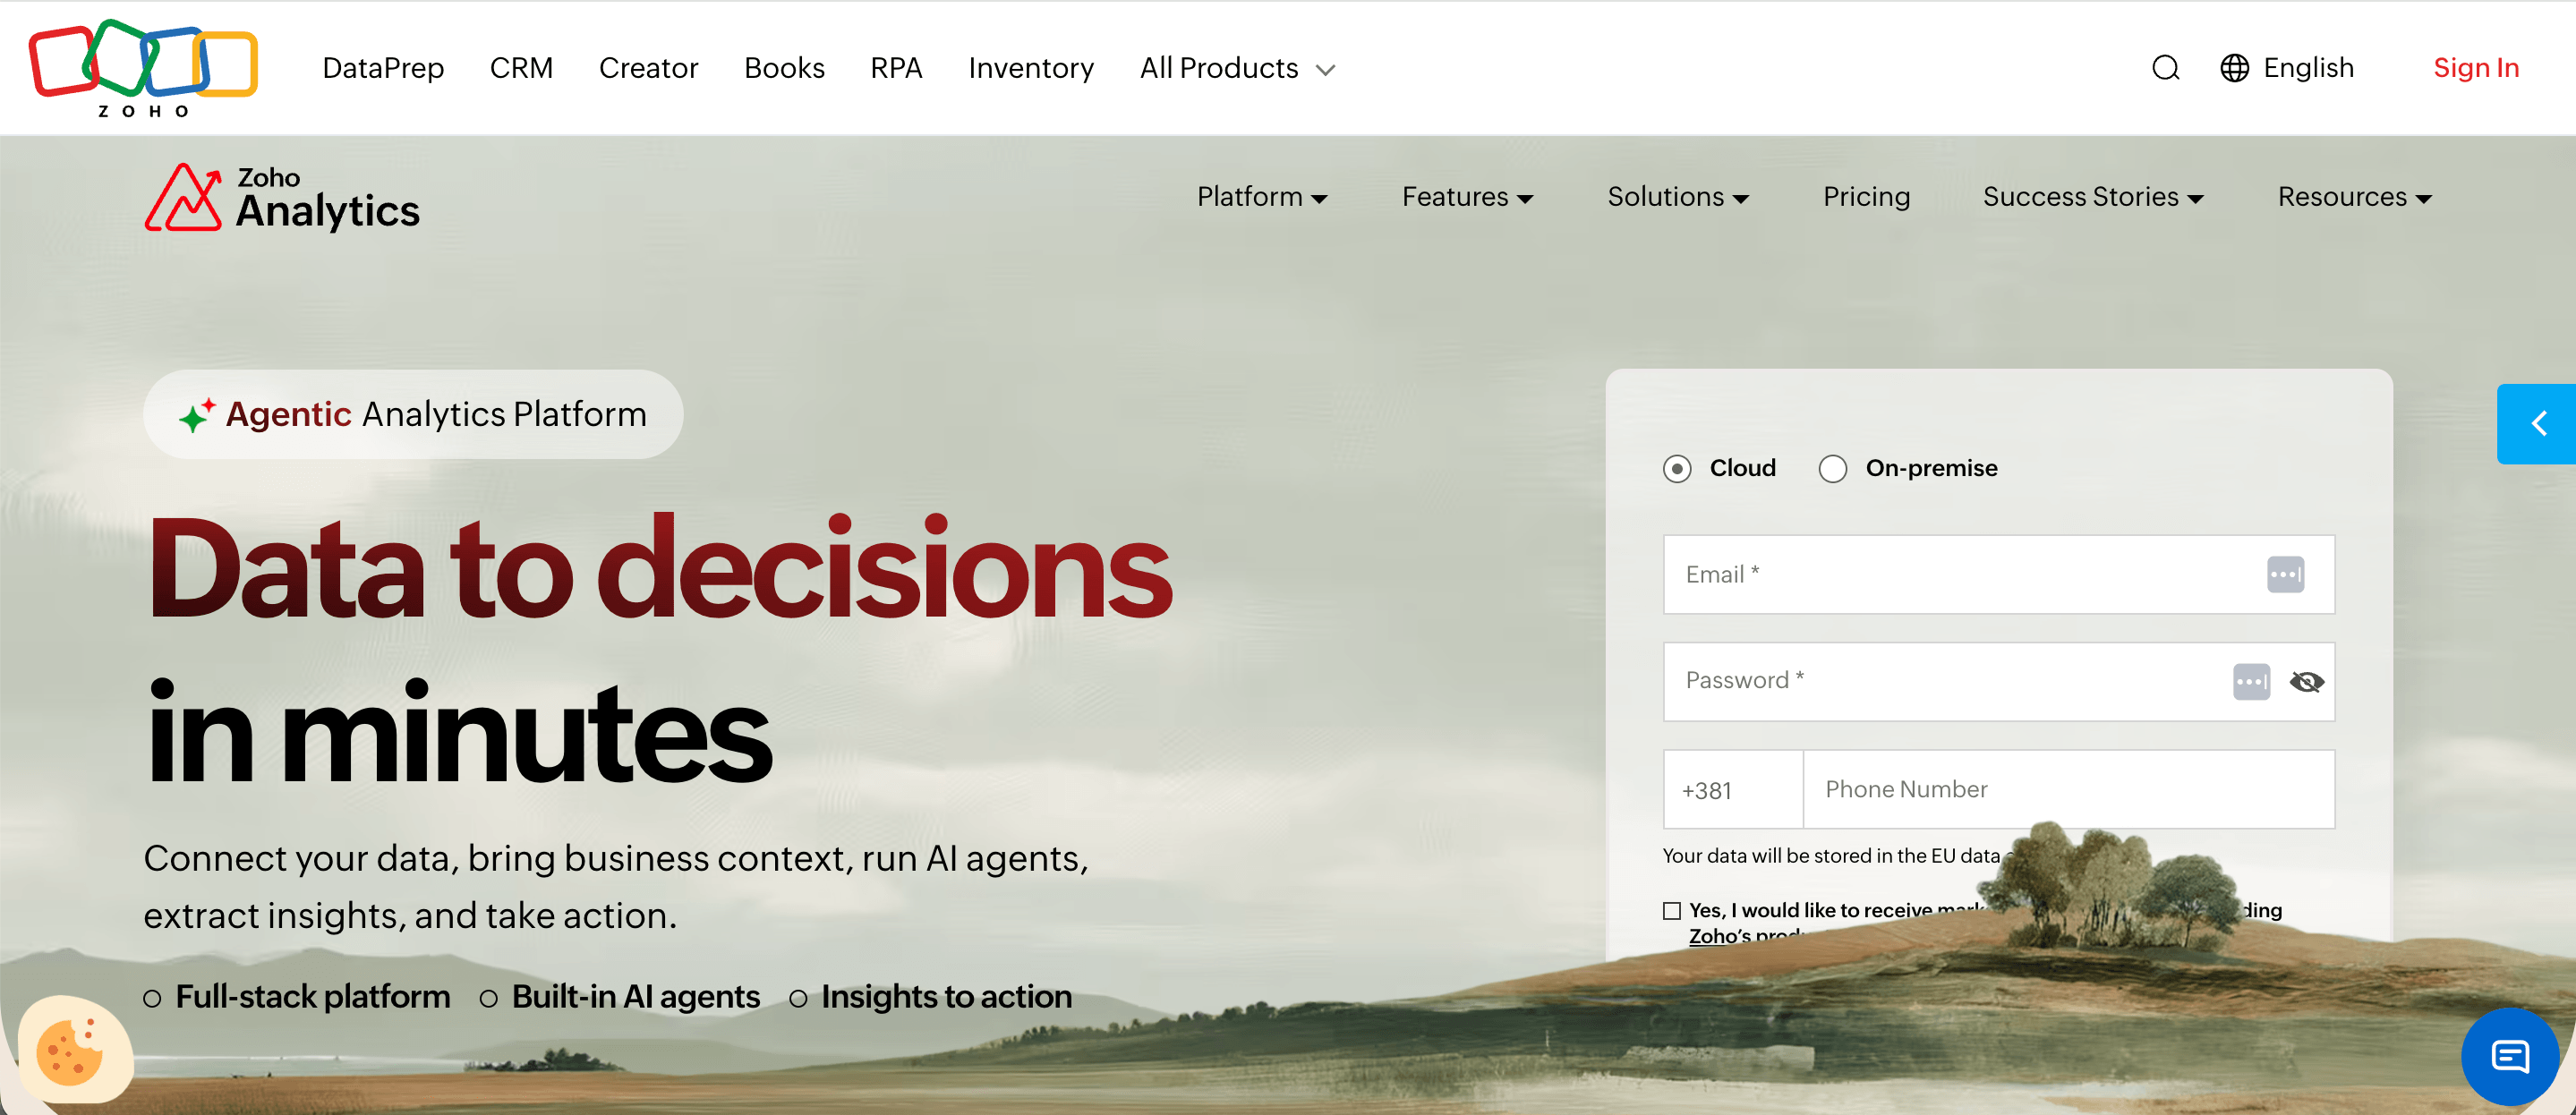
Zoho Analytics is a business intelligence and ecommerce analytics platform that helps retailers analyze sales, customer behavior, and inventory performance across multiple systems. It connects with Shopify, WooCommerce, Zoho Commerce, and other business applications, turning raw data into interactive dashboards and reports. Its advanced analytics features include demand forecasting, anomaly detection, and prescriptive analytics tools that help businesses evaluate decisions before implementing them.
Key features:
- Prebuilt ecommerce dashboards: Access over 100 Shopify reports and dashboards covering sales, orders, customer behavior, inventory levels, and shipment performance, with additional reporting templates for WooCommerce.
- Ask Zia analytics assistant: Ask questions about store performance in natural language, such as which products generated the most sales last month, and receive automatically generated charts and reports.
- Zia Insights: Get automated explanations of changes in business metrics, including unusual sales patterns and emerging customer trends, without building individual reports.
- Advanced demand forecasting: Use statistical forecasting models, including ARIMA and exponential smoothing, to predict future trends in sales and product demand based on historical performance.
- What-if scenario analysis: Test how changes in product pricing, discounts, or marketing budgets could affect sales and profitability before committing to those decisions.
- Zoho ecosystem integrations: Combine e-commerce sales data with information from Zoho Inventory, Zoho Books, and Zoho CRM to analyze stock availability, financial performance, and customer relationships in one place.
- Data blending and preparation: Import information from spreadsheets, databases, and business applications, then use custom formulas or SQL queries to combine datasets for more detailed reporting.
- Smart alerts and scheduled reports: Receive notifications when important metrics change unexpectedly and automatically distribute updated sales reports to relevant team members.
Pricing: Zoho Analytics offers a free plan for two users and up to 10,000 rows of data. Paid plans start at $24/month with annual billing, with Standard at $48/month, Premium at $115/month, and Enterprise at $455/month. A 15-day free trial is available.
10. Improvado
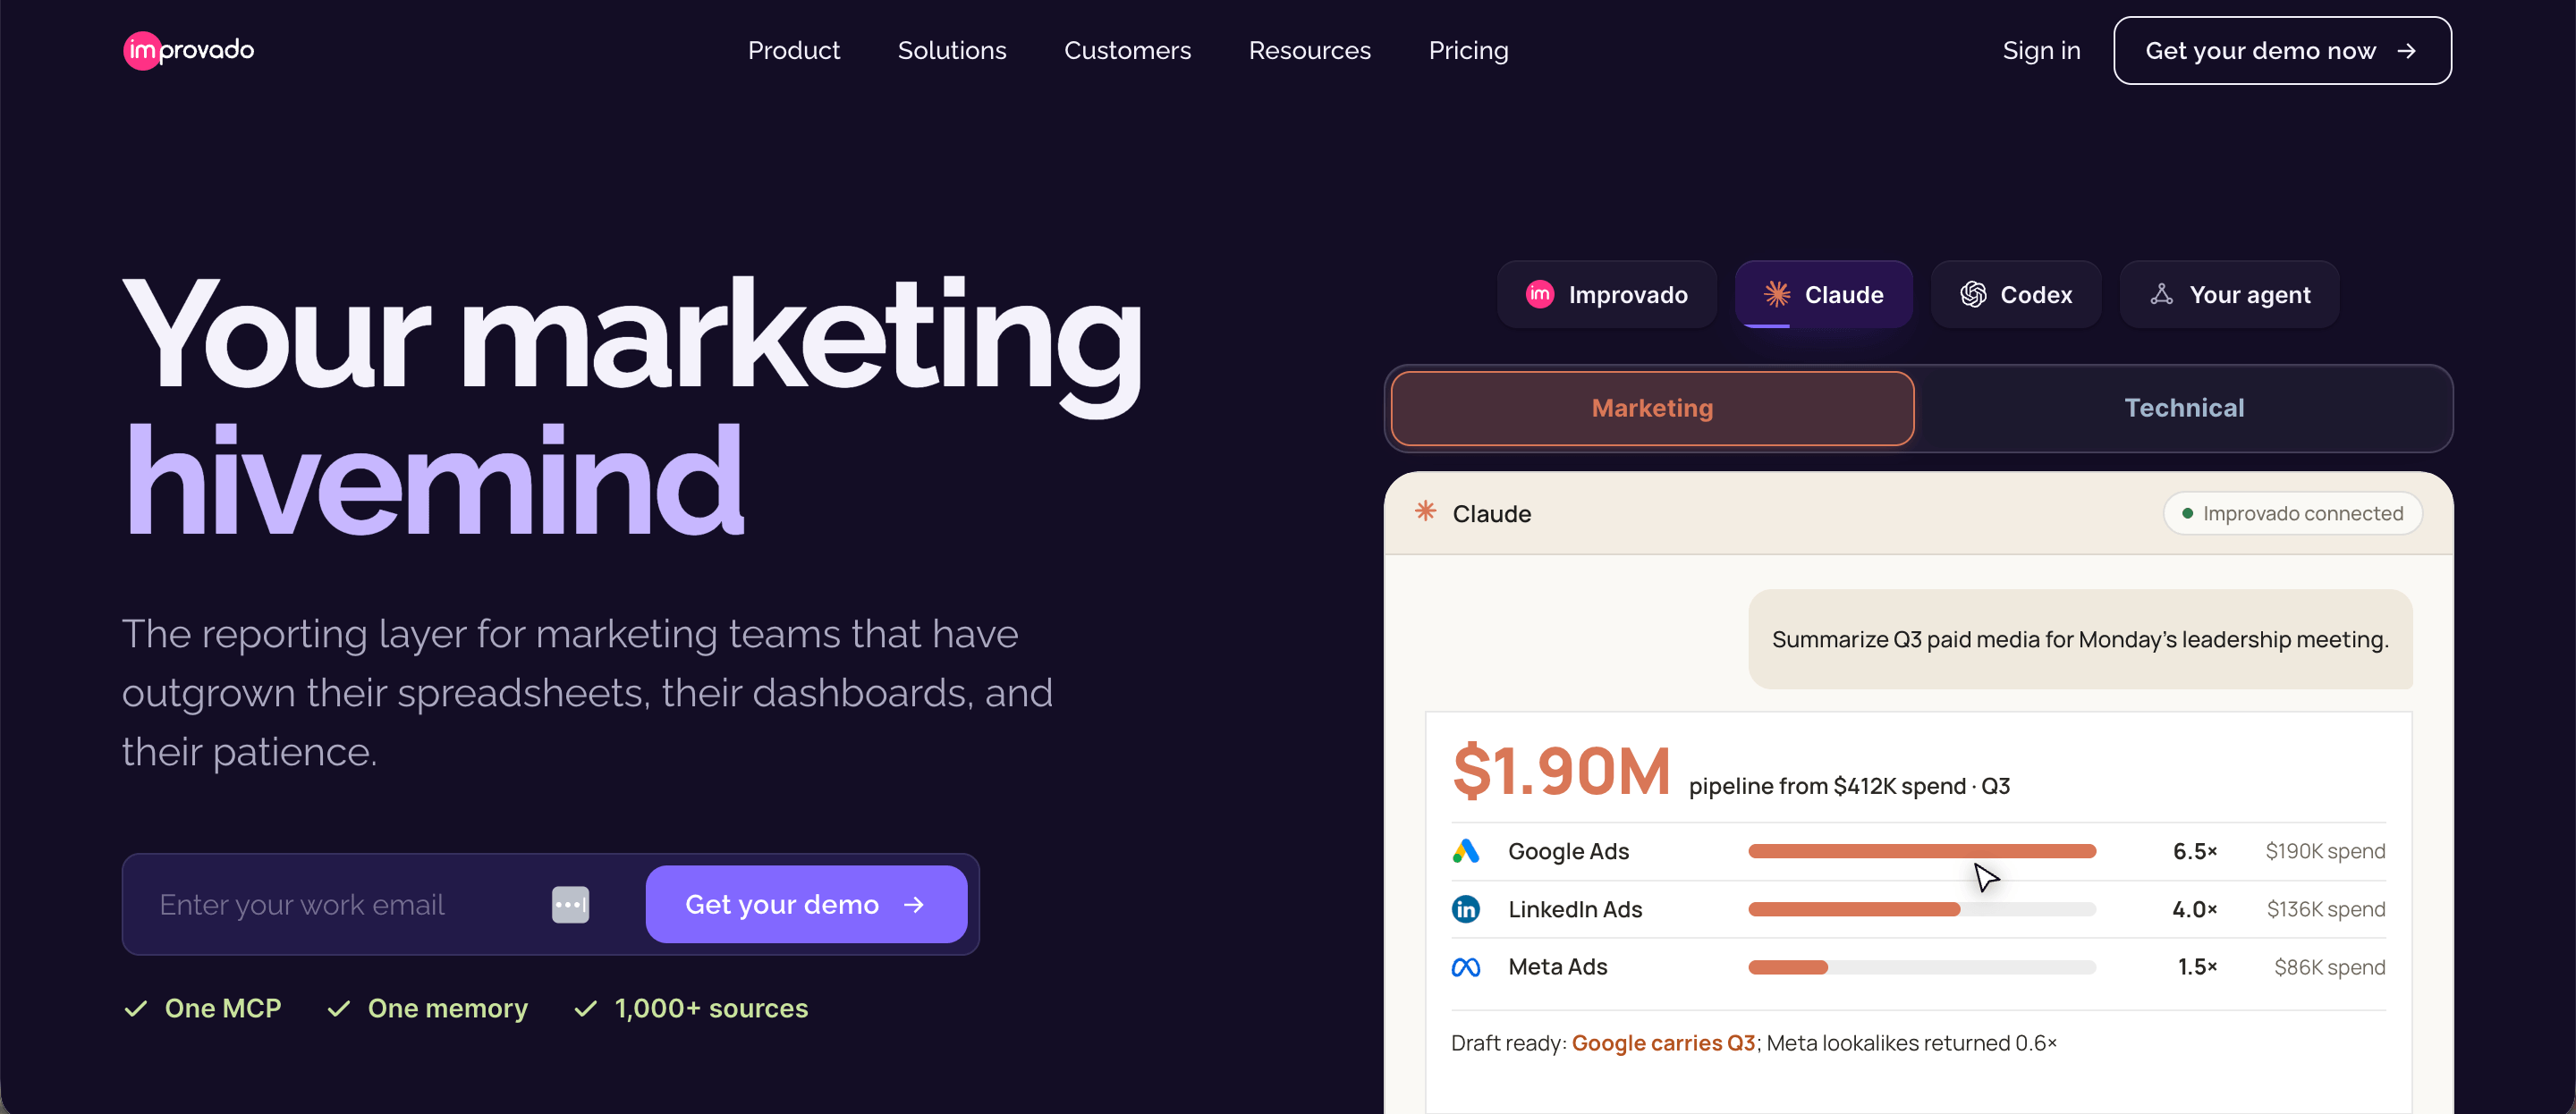
Improvado is a marketing analytics and data integration platform that helps ecommerce businesses consolidate information from advertising platforms, online stores, and other marketing tools. It brings campaign spending, sales performance, and customer acquisition data into one place, helping retailers gain valuable insights into which marketing strategies contribute to revenue growth. The platform is primarily designed for larger businesses managing substantial advertising budgets across multiple channels.
Key features:
- 1,350+ data integrations: Connect advertising platforms, including Google Ads, Meta Ads, TikTok Ads, and Amazon, alongside e-commerce platforms and CRM systems to centralize marketing and sales data.
- Automated data transformation: Standardize campaign names, currencies, and performance metrics across advertising platforms to create consistent datasets for reporting and analysis.
- Marketing Data Governance: Monitor advertising campaigns against predefined rules to detect incorrect naming conventions, budget pacing issues, and configuration errors before they affect reporting.
- Ecommerce revenue attribution: Connect advertising expenditure with sales data from platforms such as Shopify and Amazon to determine which channels and campaigns contribute to purchases.
- Marketing performance dashboards: Combine ad spending, website traffic, conversion rates, customer acquisition costs, and return on ad spend into customizable reports.
- AI Agent for marketing analytics: Ask natural-language questions about campaign performance and get answers based on connected marketing data, including explanations for unexpected changes in advertising results.
- Product and geographic performance analysis: Compare sales and profitability across product categories and regions to identify opportunities for improving advertising allocation.
- Data warehouse integrations: Transfer standardized marketing data into Snowflake, Google BigQuery, and other supported destinations for further analysis using existing business intelligence tools.
Pricing: Improvado offers a limited free plan and an MCP Only plan starting at $100/month. Its Advanced and Enterprise plans have custom pricing based on data volume, required capabilities, and business needs.
11. Woopra

Woopra is a customer journey and web analytics platform that helps ecommerce businesses understand user behavior across their websites and customer communication channels. Unlike analytics tools that focus primarily on website traffic and conversion totals, Woopra tracks individual customer interactions over time, allowing businesses to investigate what drives purchases, repeat orders, and customer satisfaction. It also connects with e-commerce platforms and marketing tools to provide a more complete view of the shopping experience.
Key features:
- Individual customer profiles: Track each visitor’s browsing history, purchases, email interactions, and support requests in a unified profile, including activity recorded before an anonymous visitor identifies themselves.
- Customer Journey reports: Map how shoppers move between marketing campaigns, product pages, checkout steps, and subsequent purchases to identify which interactions contribute to conversions.
- Behavioral segmentation: Create customer groups based on purchase history, browsing activity, device type, and other attributes to analyze how specific audiences interact with an online store.
- Magento ecommerce tracking: Automatically capture shopping events such as products added to cart, cart values, applied coupons, payment methods, and completed checkouts through the Magento integration.
- Retention and cohort reports: Compare customer groups over time to identify which shoppers return after their first purchase and how engagement changes throughout the customer relationship.
- People Reports: Build detailed customer lists using behavioral conditions and profile properties, including lifetime purchases and order counts, to identify valuable customer segments.
- Behavior-based triggers: Send customer data to connected applications when specific events occur, such as a shopper abandoning their cart or completing a purchase.
- Customer support integrations: Connect platforms such as Zendesk to give support agents access to a customer’s previous website and product interactions when handling requests.
Pricing: Woopra’s Pro plan starts at $999/month for 5 million monthly events and includes a 30-day free trial. Enterprise pricing is available upon request and includes additional capabilities for data management, reporting, and customer analytics.
12. Matomo
Matomo is a privacy-focused web analytics platform that helps ecommerce businesses track sales, customer interactions, and website performance while retaining full ownership of their data. It offers both cloud hosting and a free version that businesses can host on their own servers. Retailers can use its ecommerce reports to understand customer demand, investigate abandoned carts, and identify issues that affect conversions.
Key features:
- Ecommerce conversion tracking: Monitor completed orders, abandoned carts, average order value, purchased products, and revenue generated by individual traffic sources.
- Visitor Profiles: Review individual shopping sessions, including previously visited pages and completed goals, to understand how visitors interact with a store before purchasing.
- Internal site search analytics: Track the search terms shoppers enter into a store’s search bar to identify popular products, unmet customer demand, and searches that produce no results.
- Heatmaps and session recordings: See where customers click, scroll, and encounter difficulties on product pages or checkout forms, using visual recordings for diagnostic analytics.
- Google Analytics data importer: Transfer historical Google Analytics data into Matomo to preserve previous performance reports when switching analytics platforms.
- Privacy and data ownership controls: Host customer analytics data on your own infrastructure, configure data retention policies, and anonymize visitor information according to privacy requirements.
- Log analytics: Import web server logs from Apache, Nginx, and IIS to analyze website activity without relying exclusively on JavaScript tracking.
- Custom alerts: Receive email or SMS notifications when selected metrics change unexpectedly, such as a significant decline in e-commerce conversions.
Pricing: Matomo offers a free version for businesses that host the software themselves, while its paid self-hosted bundles start at €230/month with annual billing. Matomo Cloud uses traffic-based pricing, with a free trial available.
13. Supermetrics
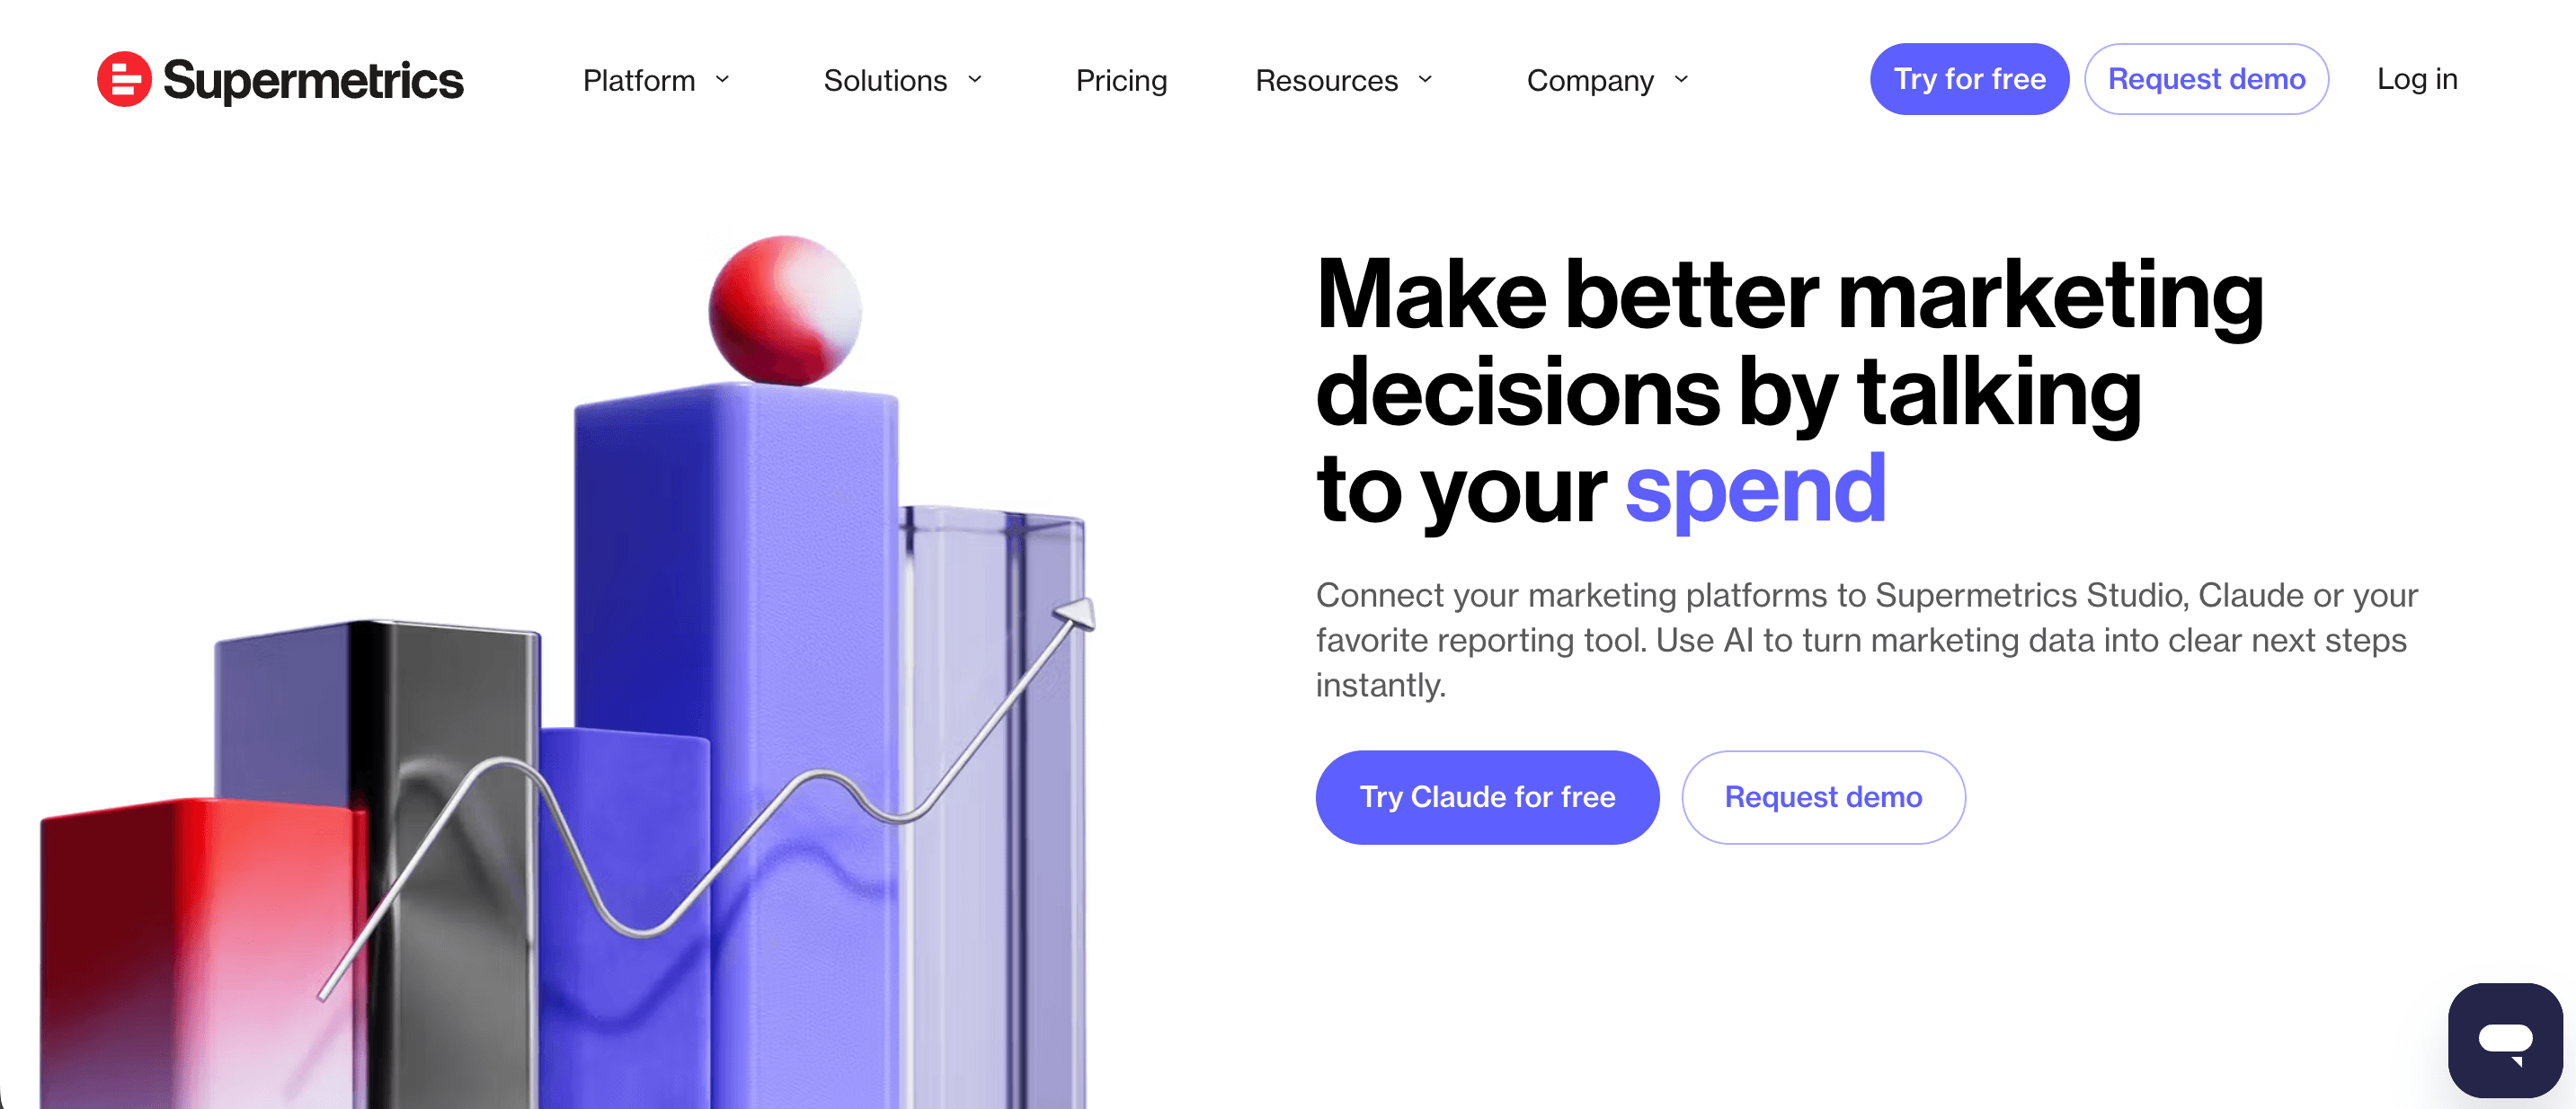
Supermetrics is a marketing intelligence platform that helps ecommerce businesses collect and analyze data from advertising platforms, online stores, and customer engagement tools. It connects with more than 150 marketing and sales data sources, including Shopify, Amazon Seller Central, Google Analytics 4, and Meta Ads. By analyzing cross-channel data, retailers can identify profitable campaigns, track customer acquisition costs, and improve marketing decisions.
Key features:
- Shopify data integration: Import detailed Shopify order information, product sales, returns, inventory levels, and customer records into external reporting tools.
- Amazon marketplace reporting: Pull data from Amazon Seller Central, Amazon Ads, and Amazon Vendor Central to compare marketplace performance with other ecommerce channels.
- Automated spreadsheet reporting: Schedule data refreshes in Google Sheets and Microsoft Excel to keep key metrics updated without repeatedly exporting reports from advertising platforms.
- Looker Studio and Power BI connectors: Transfer ecommerce and advertising data into existing business intelligence dashboards using dedicated integrations.
- Data blending: Combine datasets from advertising platforms and ecommerce stores to calculate metrics such as customer acquisition costs and return on ad spend across multiple channels.
- Data quality monitoring: Detect missing campaign tags, inconsistent naming conventions, and unusual changes in reporting data before they affect marketing analysis.
- Custom data transformations: Create calculated metrics, standardize campaign names, and convert currencies to keep reporting consistent across countries and ad accounts.
- Supermetrics Insights Agent: Analyze marketing performance using natural language questions,
14. Jimdo

Jimdo is a website and online store builder that includes analytics features for small ecommerce businesses. Its reporting dashboard tracks website traffic, product sales, and customer engagement without requiring merchants to install a separate analytics platform. While it offers fewer advanced reporting capabilities than dedicated ecommerce analytics tools, it provides useful customer insights for smaller retailers managing their stores through Jimdo.
Key features:
- Built-in store sales reporting: Monitor orders, products sold, and total sales through Jimdo’s Statistics dashboard, with separate reports for each metric.
- Product popularity rankings: Identify the most and least popular products based on store sales data, helping merchants understand which items attract customer demand.
- Historical sales comparisons: Filter store statistics by the previous week, month, or year to identify seasonal purchasing patterns and evaluate promotional campaigns.
- Website engagement analytics: Monitor website visits, visitor counts, and engagement rates to understand whether shoppers interact with product pages and other store content.
- Traffic source reporting: Identify how shoppers discover a Jimdo store, including organic search, direct visits, social media, and referrals from other websites.
- Top-performing pages: View the five most-visited pages on a website to see which product or category pages attract the most attention.
- Jimdo Companion: Access a business dashboard that analyzes website statistics, store data, and other business information, then recommends improvements based on performance trends.
- Customer contact management: Collect customer feedback through website forms and review contact histories, including previous inquiries and store purchases.
- Google Analytics integration: Connect Google Analytics 4 to measure additional ecommerce events, including online purchases, and investigate customer behavior beyond Jimdo’s native statistics.
Pricing: Jimdo offers a free website plan, but ecommerce sales reporting requires a paid online store subscription. Online store plans start at approximately $18/month in recent US pricing listings, although the exact amount depends on location and billing terms.
15. GoodData
GoodData is a business intelligence and embedded analytics platform that helps ecommerce marketplaces analyze sales performance, customer preferences, and purchasing behavior. It allows marketplace operators to build customized reporting experiences for individual merchants, helping them understand product demand and identify opportunities for ecommerce success. Businesses can use GoodData to give merchants access to their own performance data without building an analytics system from scratch.
Key features:
- Marketplace analytics dashboards: Give individual sellers access to reports showing product demand, sales performance, and purchasing trends, including which products customers want and when demand is highest.
- Customer purchase journey analysis: Identify where shoppers abandon purchases and investigate whether product availability, pricing, or other factors contribute to lost sales.
- Multitenant analytics: Create separate reporting environments for individual merchants while managing shared dashboard templates and metric definitions centrally.
- GoodData AI Assistant: Let merchants ask natural language questions about sales trends, customer preferences, and product performance to generate insights from their data.
- Forecasting and pattern detection: Analyze historical sales data to identify seasonal purchasing patterns, forecast future demand, and detect unusual performance changes.
- Reusable semantic layer: Define consistent business metrics, such as gross merchandise value, conversion rates, and average order value, so merchants use the same calculations across reports.
- Embedded analytics with GoodData.UI: Integrate interactive reports directly into marketplace websites and seller portals using React components, APIs, and customizable dashboards.
- Cloud data warehouse connectivity: Connect GoodData to Snowflake, Google BigQuery, Amazon Redshift, and other databases to analyze existing ecommerce data without rebuilding the underlying data infrastructure.
Pricing: GoodData offers a Professional plan with pricing based on a platform fee and the number of workspaces, while Enterprise pricing is customized to business requirements. Public prices are not listed, but businesses can request a quote or start a free trial.
Get the best ecommerce analytics software for CPG teams
Most ecommerce analytics tools help businesses understand website traffic, customer behavior, and marketing performance. But CPG brands face a bigger challenge: understanding what’s happening to their products across Amazon, Walmart, and hundreds of other retail partners.
At Alloy.ai, we help CPG teams connect the dots between sales, inventory, and demand across their entire retail network. Instead of piecing together reports from different retailers, you get one place to track product performance, identify inventory problems, and understand where you’re losing potential sales.
With access to daily retail data, demand forecasting, and automated insights, your team can make better replenishment decisions, prevent costly stockouts, and respond faster to changes in consumer demand.
Want to see how your products are performing across every retail channel? Book a demo with Alloy.ai and discover how we can help you turn retail data into smarter decisions.