
Retail Analytics for CPG Brands: The Complete Guide (2026)
Let me guess how your Monday starts. You log into one retailer portal, then another, then a third that times out and makes you reset your password. You export a CSV, paste it next to last week’s, and somewhere around the second coffee, you can finally answer a question your VP asked in nine seconds: how did we sell last week in the Midwest? That whole song and dance is what retail analytics is supposed to kill.
Here’s the part that gets me. The global retail analytics platform market is projected to hit about $6.88 billion in 2026, per Mordor Intelligence, and keep climbing to $8.44 billion by 2031. The tools exist. The money is being spent. And yet a shocking number of consumer brands still run their retail data like it’s 2012 — spreadsheets, manual pulls, a weekly cadence — so the “insight” lands a full week after the buyer already called about the stockout.
So this is the guide I wish someone had handed me: what retail analytics actually is, the four types people keep name-dropping, the types of retail analytics that earn their keep for a CPG brand, and how to tell a real platform from a dashboard with good marketing. Along the way, you’ll see how the right retail analytics tools turn raw data into actionable insights — the kind that help you forecast demand, optimize inventory levels, and make informed decisions instead of educated guesses.
What you will learn in this article
What is retail and e-commerce analytics?
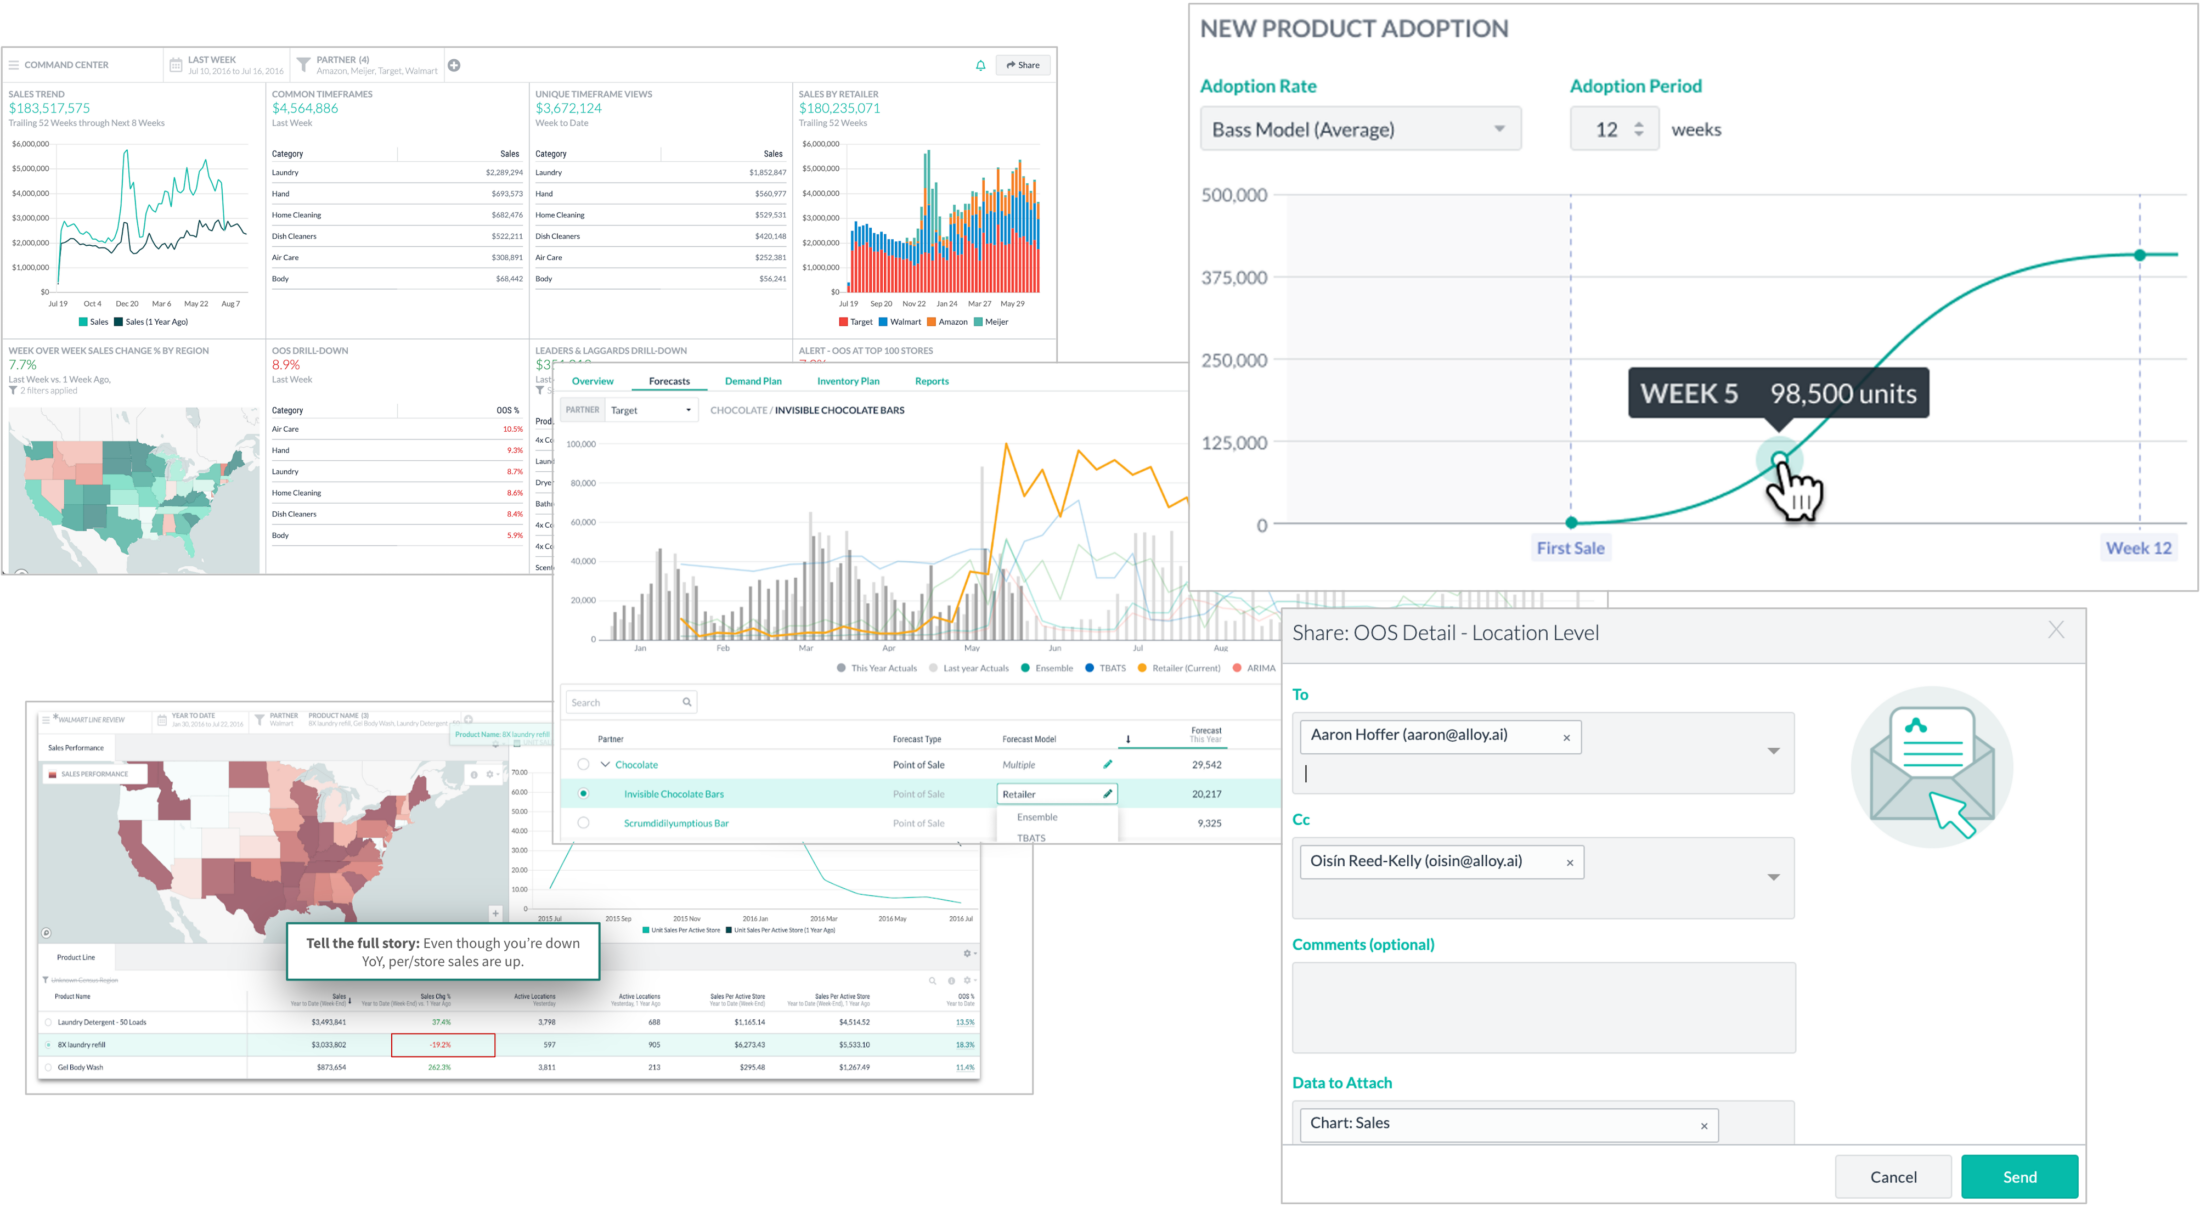
Strip away the jargon, and retail analytics involves one thing: pulling sales data, inventory data, and consumer data from every channel you sell through — POS systems that manage customer transactions, ecommerce platforms, distributor reports, supply chain feeds — and turning it into decisions you can act on. Sales performance, demand forecasting, customer behavior, the works. Data analytics applied to the specific mess of selling through other people’s stores.
But here’s a distinction people fumble constantly. When a retailer does retail analytics, they’re managing their assortment, pricing, store layouts, and labor — the data helps retailers determine what to stock and where.

When you, the consumer brand, do retail data analytics, you’re tracking what happens to your products after they land on someone else’s shelf — how customers interact with them, what your sales performance looks like store by store. Same two words, completely different problem. Read a “retail analytics” piece written for store operators and wonder why none of it fits? That’s why.
And no, it isn’t the same as general business intelligence. Your BI stack will happily chart anything you feed it — but business intelligence tools won’t walk in the door knowing how to reconcile fifty retailers who each name, time-stamp, and measure their data differently. That reconciliation is the whole job, and it’s where purpose-built retail analytics software earns its name. The complete retail analytics guide goes deeper on the buyer side if you want it.
The 4 types of retail analytics
When most of Alloy’s customers come to us, they’re analyzing Retail Link data in Excel.
Every consulting deck splits retail analytics into four types: descriptive, diagnostic, predictive, and prescriptive. It sounds like a maturity ladder you climb in order. In reality, most brands live in the first two and dabble in the third, and that’s fine. But the further up you go, the more the data does the work for you. Here’s what each one means.
#1: Descriptive analytics — understanding what happened
This is the “what happened” layer, and it’s where everyone starts. Descriptive analytics leans on historical sales data to explain past operational results — what did we sell last week, which SKUs hit plan, which retailer quietly fell off a cliff. Weekly POS sell-through, velocity scorecards, sell-through versus plan, promo recaps, actual sales figures against forecast — all descriptive. It’s necessary, and it’s also backward-looking, which is the polite way of saying it tells you about a fire after the building’s already smoking.
#2: Diagnostic analytics — understanding why it happened
Now we’re asking why. Sales at one retailer dropped 18% in week 7. Okay — but why? Did a promo end? Did a competitor launch a buy-one-get-one two aisles over? Is it phantom inventory? This is where descriptive and diagnostic analytics start earning their keep, because the answer to “why” is usually where the money is hiding. Good diagnostic analytics also leans on statistical analysis to separate a real trend from random noise.
A real-feeling example: a snack brand sees a soft week at a regional grocer and assumes demand cooled off. Diagnostic work walks the chain backwards — store inventory, replenishment cadence, the retailer’s DC stock — and turns up the real culprit: a warehouse that never reordered after a holiday spike. Demand was fine. The pipe was clogged. You don’t fix that by squinting at a sales chart.
#3: Predictive analytics — forecasting what will happen
Predictive analytics points the math forward. For a brand that means ML-powered POS forecasts at the SKU and store level, weeks-of-supply risk you can see six to eight weeks out, and demand sensing that flags a shift before it shows up in your orders. This is the engine behind sales forecasting that actually predicts future trends — future demand, future sales, the works — instead of just extrapolating last year. And to be clear, it isn’t about replacing your planners with a robot. Gartner’s Christian Titze framed it well — right now, “it’s more about decision augmentation than decision automation.” The forecast doesn’t make the call. It hands your planner a much better starting point.
This is also where generic analytics tools tap out. They’ll chart your history beautifully, then shrug when you ask what next month looks like at the SKU-store level. Retail predictive analytics goes the other way — worth knowing what separates a best-in-class demand forecast from a glorified moving average.

#4: Prescriptive analytics — recommending what to do
The top of the ladder. Prescriptive analytics takes those predictive analytics outcomes and tells you what to do about them. Order 400 units, send them to this DC by Thursday. Pull inventory from the store that’s drowning and ship it to the one that’s bare. Fund the promo at one retailer, kill it at another. It even helps retailers adjust prices and helps you meet customer demand without overbuying.
In the wild, that’s auto-drafted replenishment orders, exception alerts sorted by dollars at risk rather than alphabetically, and allocation calls when supply is tight. The point isn’t fancier dashboards. It’s fewer dashboards and more answers.

See all four analytics types in action — Book a Demo.
- ☑️ Weeks of supply
- ☑️ Future weeks of supply
- ☑️ Lost sales (at Price)
- ☑️ Lost sales (at Cost)
- ☑️ Out of stock %
- ☑️ Forecast accuracy
- ☑️ % of Forecast
- ☑️ Gross margin
- ☑️ Active locations
- ☑️ Sales per store
- ☑️ Recommended order adjustments
- ☑️ Phantom inventory
- ☑️ ROI of in-store marketing
- ☑️ OTIF
Key retail analytics use cases for consumer brands
Theory’s fine, but here’s where retail analytics involves real work in your week. Five jobs, mostly: watching sell-through, fighting out-of-stocks, forecasting demand, judging promotions, and not embarrassing yourself in front of your buyers. These are the retail analytics solutions that move operational metrics you actually report on — and they all run on the same underlying retail data pulled from multiple data sources. Some matter more than others, so I won’t pretend they’re equal.
POS sell-through and sales performance tracking
Sell-in is what the retailer ordered. Sell-through is what shoppers actually bought — and only one of those tells the truth. Daily POS data, sliced by retailer, region, store cluster, and SKU, is how you spot a problem before your buyer does, which beats the reverse. Automated performance reporting makes it scannable instead of a Tuesday-night spreadsheet marathon.
And the payoff is real. Brands on Alloy regularly see a 5%-plus bottom-line impact and millions in incremental orders — not from new data, but from finally acting on data they already had. This is also where you track key performance indicators that matter to the business: sell-through rate, weeks of supply, in-stock rate, and the operational metrics your leadership actually asks about.
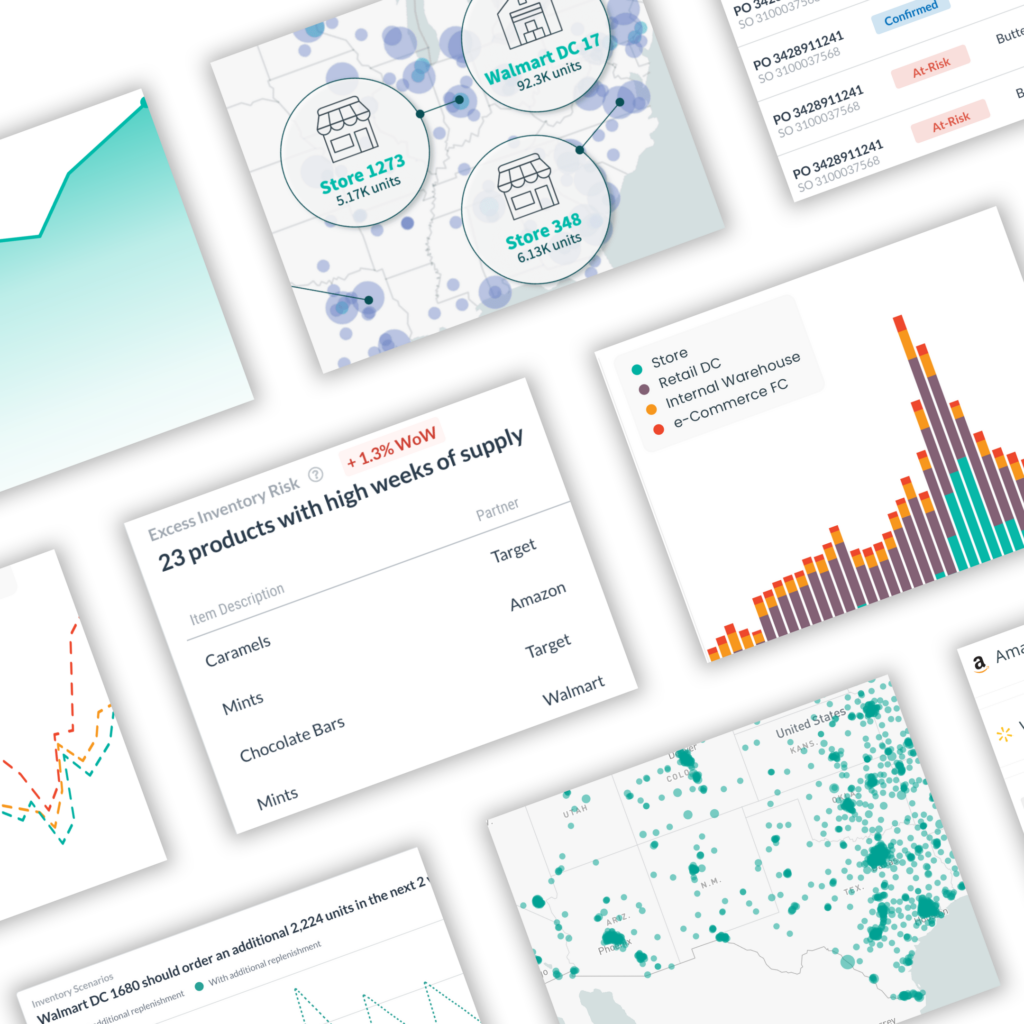
Inventory and out-of-stock management
If I had to pick the one use case that pays for the whole platform, it’s this. Out-of-stocks are a slow, silent bleed, and the numbers are absurd. Tight inventory management — the kind that comes from real inventory management systems, not a spreadsheet — is what keeps you from leaving money on empty shelves.
A study by IHL Group pegged global out-of-stocks at $984 billion in lost sales, $144.9 billion of that in North America alone. Most of those empty shelves are preventable — if, and it’s a real if, you’ve got the right inventory data showing up often enough to act on it.
Then there’s phantom inventory, which is the one that keeps me up. The system swears a SKU is in stock, the shelf says otherwise, and replenishment never triggers because the books look fine. You catch it by comparing POS velocity against on-hand reporting and flagging the SKUs that should be moving and aren’t — then use that to optimize inventory levels store by store. Brands doing this have cut out-of-stocks by 35%-plus. For the mechanics, the playbook on how to identify and prevent lost sales is solid, and there’s a separate breakdown of why phantom inventory is such a quiet menace.
I’ll let Jean-Baptiste Delabre at NielsenIQ make the point: pinpointing out-of-shelf products at the most granular level is what finally lets teams put a dollar figure on lost sales and chase the root causes instead of guessing.
Demand forecasting and planning
Most CPG forecasts are still built on shipment orders, and that bugs me, because orders are a lagging signal. By the time orders jump, the customer behavior that caused it happened weeks ago. Anchor the forecast on POS data instead, and the lag mostly disappears — which is the entire premise behind demand sensing. It’s also your early-warning system for supply chain disruptions, since you spot the demand shift before it becomes a shortage.
A decent forecast also has to wrestle with seasonality, promo distortion, and channels that behave nothing alike. The model handles that math; the hard part is feeding it clean inputs and getting the output back into wherever you plan (SAP, Blue Yonder, o9). Seasonality especially trips people up — there’s a good write-up on the role of seasonality in demand forecasting success if that’s your headache this quarter.
Promotion performance measurement
Promotions are where brands light money on fire and call it strategy. Trade spend runs 15-25% of gross sales for a typical CPG — second only to cost of goods — and if you’re grading those promos on sell-through that lands two weeks late, you’re basically scoring the game after everyone’s gone home. Real-time tracking lets you watch lift against baseline from day one and tie it back to revenue optimization, per SKU, not per channel average.
Side benefit: a rep who walks into a buyer meeting with this week’s promo numbers looks like a different vendor than the one fumbling through last quarter’s PDF. And the same data sharpens your marketing strategies — you learn which marketing campaigns actually move units and which just train shoppers to wait for a deal, which does real things for your profit margins.
Retail partnership and collaboration
Honestly? This might be the most underrated payoff of the lot. McKinsey found that 75% of CPG “winners” share data with key retailers every single week, and the other 25% do it in real time when it matters. Notice what’s not on that list: a prettier deck. The brands that win joint business planning show up already knowing something about the buyer’s own stores that the buyer didn’t. There’s a good rundown on building strong retailer partnerships if you want to get tactical.
Worth a mention here, too: customer analytics. The same instinct that drives a sell-through deep-dive applies to the shopper. Pairing retail data with customer relationship management systems lets you measure customer loyalty, estimate customer lifetime value, and understand customer behaviors well enough to read customer shopping patterns and predict future trends before they show up in the numbers. The granular view also surfaces customer service opportunities based on real behavior — a stalling repeat-purchase pattern, say, before it churns. It’s a different lens on the same goal: knowing your customer demands before they land on your desk.
Retail KPI reference table
| KPI | Definition | Formula | Why it matters |
|---|---|---|---|
| Sell-through rate | % units sold vs. units received by retailer | Units sold ÷ units received | True consumer demand vs. shipment volume |
| Weeks of supply | Inventory on hand expressed in weeks of demand | Inventory ÷ avg. weekly sales | Early warning for stockouts and overstocks |
| Out-of-stock rate | % of SKU-store combos out of stock | OOS instances ÷ total SKU-store combos | Direct measure of lost sales risk |
| In-stock rate | % of SKU-store combos in stock | 100% − OOS rate | Service-level benchmark for retailer scorecards |
| Inventory turnover | Cycles per year | COGS ÷ avg. inventory | Working capital and assortment health |
| Promotion lift | Sales above baseline during a promo | (Promo sales − baseline) ÷ baseline | True ROI of trade spend |
| Forecast accuracy | How close the forecast was to actuals | 1 − (|Actual − forecast| ÷ actual) | Drives planning and replenishment quality |
| ACV distribution | % of category ACV where SKU is carried | Carrying retailers’ ACV ÷ total ACV | Retail distribution footprint |
| Velocity | Average units per store per week | Units sold ÷ (stores × weeks) | Like-for-like SKU performance |
| Phantom inventory rate | % of “in-stock” SKUs with zero sales | Phantom SKUs ÷ in-stock SKUs | Catches shelf execution issues |
Retail analytics data sources — what data do you need?
Here’s the uncomfortable truth: you probably already have most of this data. It’s just scattered across six systems that don’t talk to each other, sitting as raw data nobody has time to analyze. POS, inventory, ERP, shipment, ecommerce, distributor, syndicated — each fills in a piece, and almost every brand is missing at least one entirely. The job is to analyze data from all of them together; do that data analysis in one place, and the picture finally resolves.
Point-of-sale (POS) data
If you only fix one source, fix this one. POS captures what shoppers actually bought — how customers interact with your products on a real shelf — not what a retailer ordered, and that’s the difference between real demand and a guess. Every line is a record of customer transactions, so it’s the cleanest way to identify purchasing patterns and read consumer behavior store by store. It comes from retailer portals (Target Partners Online, Amazon Retail Analytics, and dozens more), plus EDI and APIs. The catch — and it’s a brutal one — is that every retailer formats it differently. Normalizing fifty of them by hand is a job. Like, a whole person’s job.
Inventory data
In-store stock, DC stock, warehouse levels. You want all three, because a clean weeks-of-supply number falls apart the second one of them is missing. Skip the DC view, and you’ll find out about the stockout when it’s already on the shelf.
ERP and shipment data
The sell-in versus sell-through gap is one of the most telling numbers you’ve got. When the gap widens, inventory is piling up somewhere downstream — and a returns conversation is usually about three weeks behind it. Watch this one.
E-commerce and distributor data
Amazon Seller Central, Vendor Central, your DTC site, distributor reports. Leave these out, and you don’t have an omnichannel view — you have four separate channel views and a vague hope they add up.
Customer and qualitative data
Don’t sleep on the softer stuff either. Customer feedback, product reviews, even customer service chats are consumer data that explains the “why” behind a sales dip your numbers can’t. A spike in one-star reviews mentioning a packaging change will show up in feedback weeks before it dents your sell-through, and that early read on financial performance is worth having.
Retail KPI reference table
| Data Source | What it measures | How it's delivered | Key challenges |
|---|---|---|---|
| POS data | Actual consumer purchases | Retailer portals, EDI, APIs | 50+ different retailer formats |
| Inventory data | On-shelf, DC, and warehouse stock | Portals, EDI, ERP feeds | Mixed cadences, often delayed |
| ERP/shipment data | Sell-in orders, production schedules | Internal ERP (SAP, Oracle, NetSuite) | Doesn’t reflect consumer demand |
| E-commerce data | Online sales by SKU and channel | Amazon Vendor Central, Shopify | Different attribution per platform |
| Distributor data | Indirect channel sales | Distributor reports, EDI | Lag and gaps in coverage |
| Syndicated data | Category and competitive benchmarks | NielsenIQ, Circana, SPINS | Lower granularity, paid access |
How to choose a retail analytics platform
Vendor demos all look incredible — they’re built to. So when you’re actually evaluating a retail analytics platform, ignore the sizzle reel and pressure-test five things: retailer coverage, data freshness, granularity, the AI, and whether it plays nice with your planning stack. Nail those, and the rest is preference.
Retailer coverage
Aim for 450+ pre-built connections, minimum. Custom ETL builds are slow, pricey, and they break at the exact moment you need the data. Before you sign, get them to confirm your specific retail partners are already wired up.
Data freshness
Daily is the floor. Weekly refresh cannot manage out-of-stocks — the shelf’s been empty for days by the time you see it. For inventory exceptions, you want same-day or live alerts, not a Monday digest.
Granularity — SKU and store level vs. aggregate
Aggregate, channel-level numbers are where problems hide. The patterns that drive out-of-stocks live at SKU/store/day. Anything chunkier and you’re solving last week’s problem, slowly.
AI and predictive capabilities
Push past reporting. Does it forecast, detect anomalies on its own, and rank exceptions by dollars at stake? Advanced analytics should hand you actionable insights, not just another chart to interpret. That’s the line between a modern platform and an old BI tool in a retail context.
Integration with planning and data warehouse tools
Last one, and people skip it: the data has to leave the dashboard. If insights can’t flow into SAP, Snowflake, or wherever your planners live, congratulations — you just bought another silo. The 5 key criteria for efficient retail analytics has the checklist.
How Alloy.ai powers retail and ecommerce analytics for consumer brands
Full disclosure on what we built, since you’ve read this far. Alloy.ai hits all five criteria: 850+ pre-built connectors across retailer portals, EDI, ecommerce, distributors, and ERPs, with data normalized and refreshed daily down to SKU/store/channel — and anomaly detection that floats the costliest exceptions up instead of dumping 400 alerts on you.
The ML-powered POS forecasts export straight into your planning systems, and customers see demand planning accuracy climb by up to 35%. Replenishment recommendations get drafted for you, with the AI and machine learning capabilities doing the unglamorous work underneath.
Crayola, BIC, Valvoline, Bosch, SimpliSafe, Melissa & Doug — they all run their retail business on it. And the pattern repeats: 35%-plus fewer out-of-stocks, millions in orders that would’ve quietly slipped away, and valuable insights surfaced fast enough to actually use.
Ready to see it work on your data? Book a Demo.
Closing thoughts
Retail analytics shouldn’t be a reporting chore anymore. For a brand juggling a dozen retailers and three channels, the right retail analytics tools work more like a nervous system — telling you what’s selling, what’s stuck, and what to do before Friday, while flagging the future trends worth betting on. Climb from descriptive to predictive to prescriptive and the wins are concrete: fewer stockouts, sharper forecasts, faster calls.
And you don’t have to boil the ocean. Swap one manual spreadsheet pull for a daily POS feed, see what it catches, go from there. If you’re tired of the Monday ritual, book a demo and see what your retail data looks like when something’s actually watching it for you.
FAQ
What is retail analytics?
Retail analytics is the process of collecting and analyzing data from across retail operations — POS systems, inventory records, ecommerce platforms, and supply chain networks — to understand sales performance, forecast demand, and make better decisions. For consumer brands, it provides visibility into how products are performing inside retailers’ stores, so teams can act on real consumer demand rather than estimated shipment data.
What are the 4 types of retail analytics?
The four types are: (1) Descriptive — summarizes historical data to show what happened; (2) Diagnostic — identifies why a specific outcome occurred; (3) Predictive — uses machine learning to forecast what will happen next; (4) Prescriptive — generates specific recommendations based on predictive outputs. Most consumer brands start with descriptive and progressively adopt predictive and prescriptive capabilities.
Why is retail analytics important for consumer brands?
It replaces manual, delayed reporting with real-time visibility into how products are selling at every retailer and channel. Without it, brands rely on shipment orders, which lag true consumer demand by weeks — leading to out-of-stocks, excess inventory, and missed revenue. With retail analytics, brands detect out-of-stocks early, measure promotion effectiveness in real time, produce more accurate forecasts, and bring data-backed insights to retailer meetings.
What data is used in retail analytics?
Retail analytics uses several sources: POS data (actual consumer purchases at the store or channel level), inventory data (in-store, DC, and warehouse stock), ERP and shipment data (sell-in orders and production schedules), ecommerce platform data (Amazon Vendor Central, DTC sites), and distributor sales data. POS data is the most critical input because it reflects true consumer demand — not the lagging signal of retailer orders.

Logan Ensign
Logan Ensign is vice-president of client solutions at Alloy Technologies, Inc. where he works with customers to maximize value from the data, analytics and planning platform by ensuring fast implementation, delivering trainings, sharing ongoing best practices and conducting regular business reviews.
Book a Demo
See Alloy.ai
Synchronize execution to eliminate waste, mitigate risk, and capture every revenue opportunity.
Once you submit a demo request form:
- A sales rep will email you within 24 hours to schedule a brief intro call.
- Our team will provide an overview of Alloy.ai and learn more about your data goals and objectives.
- We’ll create and walk you through a live demo, customized to your specific data needs.