
Follow these steps to ensure the right product is on the shelf when and where a shopper wants it, so your brand never misses out on a sale.
1. Identify specific instances of OOS (out-of-stocks) or phantom inventory
By analyzing granular POS and inventory data provided by your retailers, you can identify OOS and phantom inventory at the SKU-location level. Uncover phantom inventory at stores with inventory but no sales outside of the expected range. For unresolved OOS, you should look at stores sold through for two weeks with no inventory on-order.
2. Quantify your losses
Quantifying losses is key to motivating your partners and necessary to prioritize where to focus. Saying “you’re losing $124,450 every week” is much more powerful than saying “you’re 3.2% out-of-stock,” even though they’re both true. One common way to calculate lost sales uses historical sales or a POS forecast to estimate what demand would have been if you had been in-stock (also known as unconstrained demand) and current inventory levels.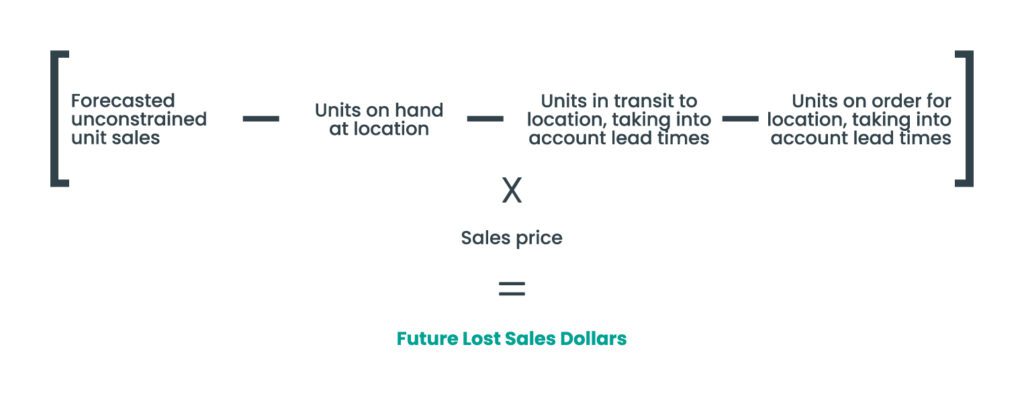
3. Prioritize based on value-at-risk
Lost sales are expected in a retail environment, but by focusing on the SKU-location instances where you stand to lose the most, you can significantly mitigate your losses. Filter based on the magnitude of lost sales so you can drill down deeper to diagnose the most valuable opportunities.
4. Diagnose the root cause to uncover viable solutions
A wide variety of factors can cause lost sales, but you likely know your most common ones. Start with a hypothesis and test it as you pinpoint what’s going wrong. Perhaps your retailer’s replenishment schedule or forecast is off? Maybe you’re experiencing a recent demand shift that your retailers haven’t reacted to yet? Comparing actual sales against your retailers’ forecasts, inventory positions and order patterns will help you reveal the problem.
5. Identify the solutions
Based on the root cause, you can evaluate the right actions to take internally and to recommend to your partners. These solutions often require acting on multiple time horizons across multiple data sets. Say you determine your forecast was too low and your retailer was under-ordering. You need to both adjust your demand plan and ensure your retailer orders more now to meet near-term demand. That’s the solution this leading fitness equipment maker identified for their customer.
6. Use data-driven storytelling to deliver your recommendations
Retail buyers prioritize brands that support their recommendations with data and analytics. Package your insights into a data-driven narrative that highlights the cost, root cause and specific actions they need to take and share it with your retail partner. In some cases, you may even be able to drive action yourself, like with a store-specific order (SSO).
7. Follow up and measure progress
After your actions have been implemented, analyze their impact using historical data. What would lost sales have been if you had been OOS for another week? Continue to communicate those insights to external and internal partners to close the loop and continually build trust.
When it comes to bringing insights to retailers, you can really stand out with rigorous measurement of marketing promotion effectiveness. Insights into what influences demand for your products are incredibly valuable to buyers as they may be more broadly applicable to the category, helping them better understand shoppers and manage their business. If they can rely on you for these learnings, you’ll become an invaluable partner.
However, too many suppliers simply look at sales performance during a promotion, compare it to the period before, and draw a conclusion on its effectiveness. If sales went up, the promotion worked! Isn’t that what we’d all like to hear? In reality, though, many other changes could have caused the sales increase, from the weather to a sale on a complementary product. It might have been your promotion, but if not, imagine what happens when you run the promo again and don’t get the same results. You could undermine your buyers’ trust – not to mention the dollars wasted.
Here we’ll outline an approach for measuring the ROI of marketing promotions that balances statistical sophistical with practicality, so you can get reliable results without a team of data scientists.
It can be applied to a wide variety of tactics we broadly refer to as “marketing promotions,” such as a price discount, circular promotion, end cap or other store display, or TV or out-of-home (OOH) campaign. Based on the concept of “test and learn,” we take a scientific approach to business experimentation by comparing a “test” group to a “control” group.
1. Bring together all consumer demand signals (POS, direct shipments) across all retailers and channels
You need sell-through data to determine if a promotion had the intended effect on consumer sales. Customer orders don’t accurately reflect true demand, and are not what buyers care about. This analysis requires store-level data so you can separate “test” and “control” locations. It should also encompass every location, particularly if you’re trying to measure a promotion that a consumer could have seen, regardless of what retailers they shop at, to capture the total effect.
2. Group the locations where the promotion was run
This group of locations (stores, states, regions, etc.) is your “test group,” where a change happens. It’s a fairly straightforward step as long as you designed the promotion and kept records of it. If it’s a promotion that a retailer ran and didn’t provide you with the specifics on, it’s a bit trickier, but you may still be able to identify what locations were impacted based on other indicators.
3. Group locations where the promotion was not run
This group of locations is your “control group,” where a change does not happen. Correctly selecting your control group is critical to minimizing bias.
You want your control group to have a representative makeup of locations across key dimensions for a reasonable comparison. For example, if all the top-performing stores are the test group, and all the bottom performers are the control group, that’s not fair! Ideally, you design promotions with test-and-learn in mind.
That means you purposefully hold back certain similar locations from running it to help measure effectiveness. You can still apply this approach if not, though. It may so happen that certain locations didn’t have the promotion because of execution issues, or you can select another geography or group of retailers that has many similar characteristics to where the promotion was run. Put some thought into this decision and just understand the limitations of your choice, if any.
4. Measure the percentage change in sales of the control group before and during the promotion
The change in sales is how you would expect your test locations to perform if they did not run the promotion. Say, your promotion is four weeks long. If sales during that period were 5% higher than the four weeks before the promotion, you can assume that your test locations would have otherwise seen a 5% increase in sales too.
5. Measure the sales performance of the test group before and during the promotion
Using the same time periods as in the last step, determine total sales for the test locations leading up to the promotion and while it took place. The dollar value difference is the change in sales you realized from the combined impact of the promotion and other factors that would have also affected the control group.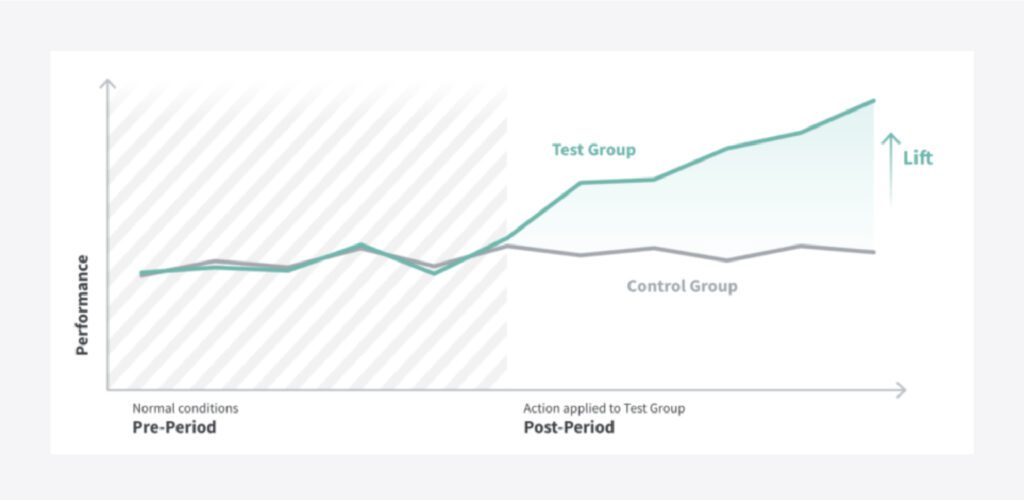
6. Calculate the incremental impact and sales lift from the promotion
Here’s the exciting part! Determine the difference between your actual sales for the test group and expected sales based on the control group. Continuing the above example, say sales for the test group were $1,132 in the four weeks before the promo. Applying the percentage increase in sales from the control group (36%), we would expect sales during the four-week promo to be $1,540. Sales actually totaled $3,703. That difference of $2,163 is the isolated incremental impact of the entire promotion!
You may want to further break down this overall impact number by week, product, or store to see if the impact was uneven. Perhaps almost all the increase came from the first two weeks. You now have an actionable learning for the next time you run a similar promo.
You can also translate this dollar figure into a sales lift % by dividing the impact by the expected sales. In this case, it’s about 140%! Lift percentages are particularly useful when you’re comparing multiple promotions to understand their relative effectiveness.
7. Calculate the ROI from the promotion
The final step in your analysis is to determine the ROI, given your investment in running the promotion. Even a promo with a positive impact can have a negative return if it was expensive to run.
8. Share the insights
Once you’ve learned what does (or does not) drive an increase in sales, make sure to relay your data-driven recommendations back to your retail buyer promptly. That could mean as soon as the promo is over or even mid-way through, when there’s still an opportunity to make adjustments to increase its impact. Use the data to shape the story you tell. Even if a promotion doesn’t deliver the lift you had discussed, proactively sharing the information and learnings builds trust. Your buyer will know they can count on you for sound analyses and feel confident in your results the next time you come back with a high-impact number!
When orders exceed inventory available in your warehouses, you’re faced with tricky allocation decisions to maximize sales and keep customers happy. Use these S&OE practices to bring unbiased analytics to the conversation and even prevent allocation situations.
1. Prioritize orders that will mitigate the most lost sales
You lose sales any time your product isn’t on the shelf when a shopper wants to buy it, but not every unfilled order means empty shelves. Quantifying the cost in terms of downstream lost sales helps you make better decisions and more compelling recommendations to retailers.
Calculate Lost Sales $ at the SKU-location level, using historical POS or a forecast to estimate unconstrained demand. This simulated metric projects what demand, and thus sales, would be if you were in stock during a given period.
While there are other factors like transportation costs, OTIF fines, and customer relationships to consider, begin by prioritizing a retailer’s orders that will prevent the most Lost Sales $. Best-in-class companies then take it a step further by prioritizing orders across all retailers.
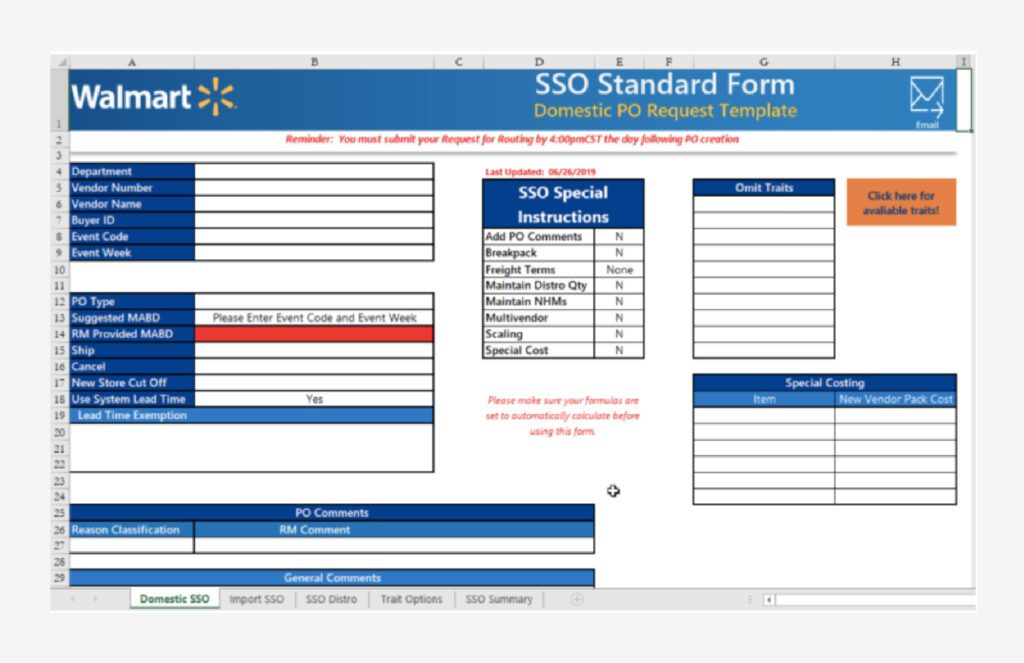
2. If available, use store-specific orders (SSOs) to directly target your highest performing stores
When demand spikes, it’s particularly important to send your inventory to locations with the greatest sales velocity. Walmart suppliers can help ensure that happens by placing store-specific orders through Retail Link®.
Other retailers also expect suppliers to make fulfillment recommendations. Connect POS data, available inventory, and shelf space to make targeted, store-level suggestions that protect mutual revenue and build trust.
3. Proactively identify and communicate any bottlenecks at retailer or distributor DCs
Even when you’re chasing demand, inventory can get stuck in DCs or overstocked stores because of replenishment errors, sometimes even leading to spoilage and markdowns. With the right visibility, you can free up this inventory earlier to help make allocation situations less dire or prevent them altogether.
Track weeks-of-supply across all your retailers and distributors so you can proactively identify unproductive inventory anywhere in your network and take corrective action. Start by working with your partners to adjust future orders where necessary and deploy stagnant inventory to shelves where it is more likely to sell through.
4. Use projected weeks-of-supply simulations to get ahead of future inventory risks
This forward-looking metric is key to predicting where outages may occur, empowering you to take proactive steps to mitigate the most significant risks. It can also help you communicate your allocation decisions to your partners, who may be willing to adjust their orders if you can point to excess weeks-of-supply in their pipeline.
To simulate projected weeks-of-supply at a given location, you’ll need some measure of expected inflows and outflows, as well as units on hand. How you measure inflow and outflow will depend on what data is available. You could use scheduled, forecasted, or planned receipts for inflow. For outflow, you can use planned, forecasted, or requested shipments, or simply use forecasted sales. Bring it all together to project the number of days until on-hand goes to zero.
5. Continually monitor your retailers’ forecasts for accuracy and changes
Staying on top of your retailers’ forecasts and any changes they make will maximize the time you have to react to a shift in orders. It’s also a handy data point when negotiating an unexpected order that comes in.
Furthermore, tracking your retailers’ forecast accuracy over time helps you highlight sources of error to your buyers. Then you can work together to improve performance and avoid allocation situations caused by last-minute changes.
6. Clearly communicate why orders are going to be short and how you’re fixing it
When you make data-driven order allocation decisions, you’re not only driving top and bottom line value, you’re building trust with your buyer. But that doesn’t mean just showing a bunch of numbers to prove you’re data-driven. Craft a narrative that prioritizes what’s most important to your buyer and diagnoses the underlying issues so you can also share how you’re resolving them.
Data-driven storytelling is rapidly becoming one of the most valuable skills for consumer goods sales and supply chain professionals to stand out to retailers.
7. Fight against the silos that separate sales, planning, and supply chain teams
Chasing demand is a team sport. You must maintain alignment between the salespeople managing partnerships, the operators executing your supply chain, and the planners trying to make sure you can keep up with demand in the medium and short term. Set up a single source of truth and a common platform to improve communication, so you won’t be stuck cutting orders in the future.
If only data-driven insights and recommendations were enough, standing out to buyers and influencing change would be a lot easier. But we talk to a lot of brands that spend weeks carefully analyzing their data, identifying insights, and preparing a case for increasing orders, only to meet with their buyer and have their ideas ignored.
Retailers have their own teams of data scientists and algorithms that they trust. Breaking through isn’t just about using data. How you deliver the insight is almost as important.
Whether it’s about the effectiveness of a marketing promotion, replenishment schedules, or out-of-stock issues, if it’s not shared in a way that gets a buyer to listen, it will sadly go ignored.
Here are five tips to make your data-driven insights stand out. Apply them consistently to build stronger, more collaborative relationships with your retailers. They’ll trust your recommendations to order more, expand distribution, adjust replenishment, or make other changes that would benefit your business.
1. Know their metrics (and use them)
Every retailer, and even a buyer or inventory manager at a retailer, operates a bit differently. They use their own measures of product success. For example, this CE sales pro found that Best Buy is all about out-of-stock percentage, while Amazon cares most about on-time delivery date.
Communicate using each retailer’s key metrics and “language.” That means put it in terms they care about, like GMROI and lost sales, and use their product hierarchy, naming, etc. If retailers don’t have to translate your sales pitch, you have a much better chance of making your case.
2. Show them the bigger picture
Even established retailers can’t know everything. They are limited by the data they have on sales at their own stores. As one former merchant put it:
The greatest power that you deliver is the macro knowledge of the marketplace. A retailer can only see the possibility of their sales in terms of their perspective. – Greg White
Present unique insights that only you can offer, like how your products are selling in their stores relative to other retailers. Using the context of the overall market makes your insights that much more powerful. It turns you into a trusted authority that provides clear value-added to the buyer.
3. Make it pop
Data has a reputation for being boring. Even the most data-driven person’s eyes have glazed over when shown a spreadsheet of data. So we create charts and graphs that are easier to digest, which helps.
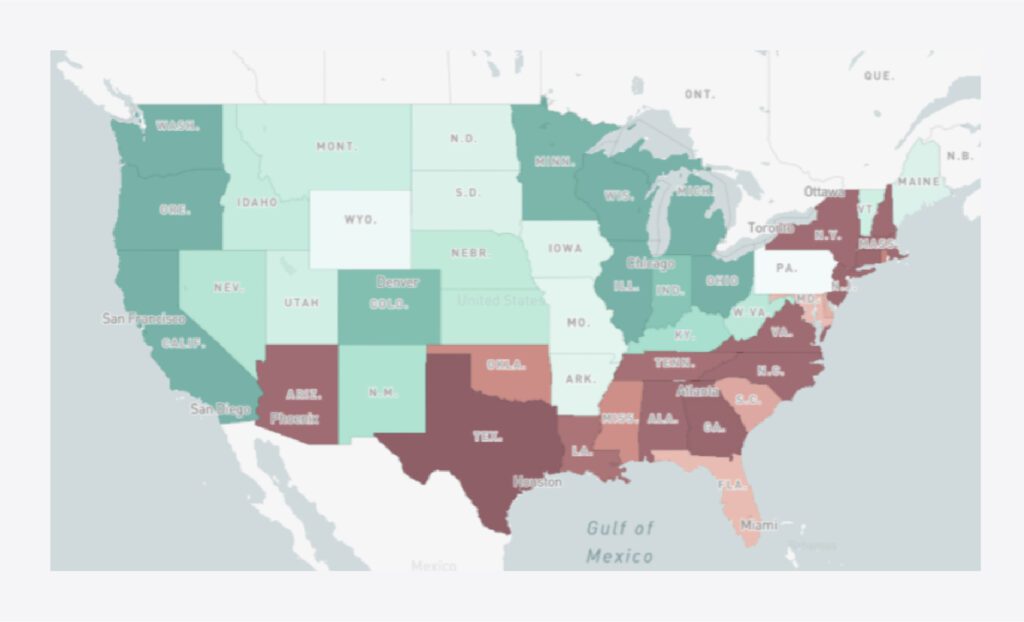
Take it to the next level by visualizing data in the best format based on the point you’re trying to make. For example, if you’re trying to show that sales were down because of an unusually long hurricane season, show sales on a heat map of the country, divided by state, or even better, by county. Make it so that a simple skim is enough for you to get your message across.
Turn it into an interactive experience. Did the long hurricane season affect all products the same? If it’s easy to throw on a product filter and see the data change, you can keep answering the next question. The buyer will not only feel more confident in your insight but remember it after engaging directly with the data that led to it.
4. Suggest a trial run
Retailers want to limit risk. A large product order or nationwide promotion may be too much to ask, even with a strong pitch. Have a plan B: a test run. A test run is an important part of the brand-building process, as you are not only advancing retailer relationships but also gauging shopper reaction and gathering more data to drive a successful rollout.
As part of the trial run, make sure you have a plan in place for measuring impact. Compare performance in a “test group” vs. a “control group” that are as similar as possible in every other way to avoid bias. And don’t wait until after the test is over to check the results; track how it’s doing while it’s still in market so you can make adjustments and improve your chances of success.
5. Deliver timely, actionable recommendations
With predictive analytics, you can simulate what the future will look like. Not only use POS data to forecast future sales, but also combine it with real-time inventory and order data to simulate future Weeks of Supply and identify likely out-of-stocks before they happen. This type of data-driven insight stands out because it captures opportunities while they still exist, not after.
Connecting your insights to a very specific action (a “prescriptive recommendation”) the retailer should take is critical. Pinpoint the root cause of the issue, such as a particular retailer, DC, or product. Then recommend exactly how many more units they need to order, or what they should shift the product mix to. Don’t leave the conclusion up to them, or they may not take the time to reach it.
“In an age of information overload, a CPG company must be able to generate insights that aren’t simply descriptive or explanatory, but predictive and prescriptive—offering fact-based answers to the questions, ‘What will happen?’ and ‘What should we do to get the most benefit out of what will happen?’ No longer will it be enough to generate insights at the national, channel, or customer level on a weekly or monthly basis. Retailers will expect store-specific, real-time insights tailored to their strategic priorities.”
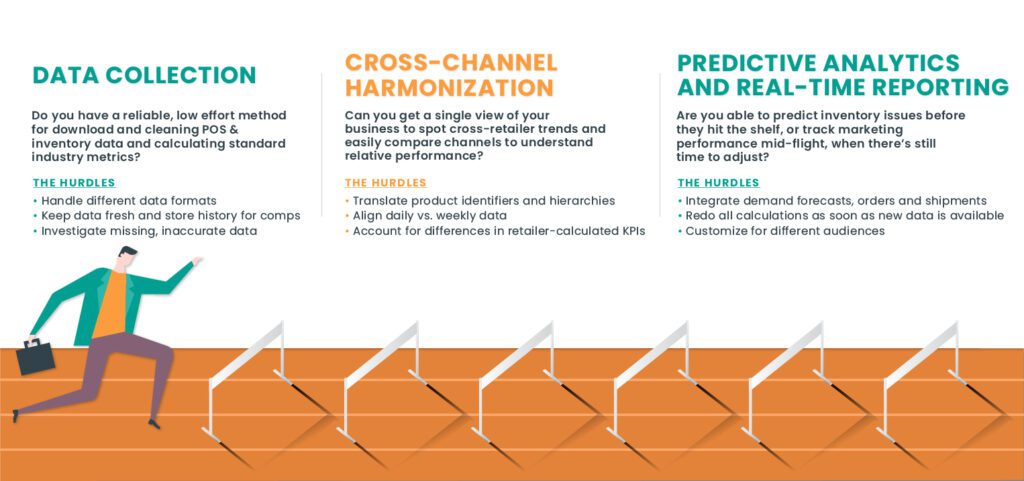
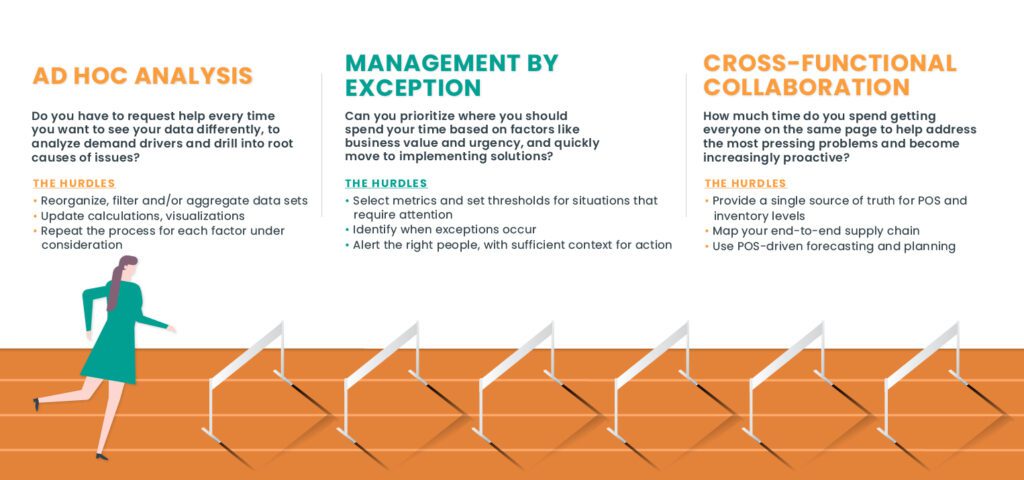
When it comes to putting it all in practice, your approach to retail analytics makes a difference. Relying on manual reports, siloed solutions, or generic business intelligence tools not only makes the process a pain for your team but also takes too long to impact immediate sales.
Ask yourself whether each of these hurdles to insight and actionable recommendations is one that your solution efficiently manages for your sellers, or leaves you pushing through on your own.

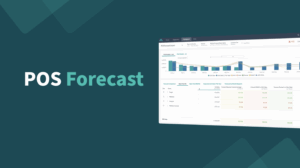
Retailer POS Forecast Dashboard Demo Video
Watch Alloy.ai’s POS Forecast demo: demand-sensing forecasts, forward-looking WoS, weekly backtesting, and exports to planning systems to prevent stockouts.
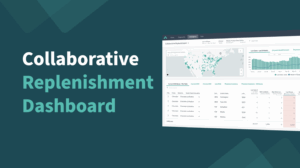
Collaborative Replenishment Dashboard Demo Video
Watch the Alloy.ai Collaborative Replenishment demo to see how you can surface current and chronic out-of-stocks and phantom inventory, and align with retail partners to…
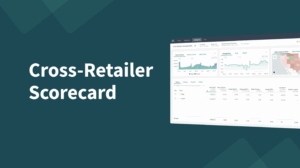
Cross-Retailer Scorecard Demo – Monitoring Inventory & Sales Trends Across Retailers
Watch Alloy.ai’s Cross-Retailer Scorecard demo to compare retailer performance weekly, spot outliers fast, and drill from partner to location to SKU to act fast.
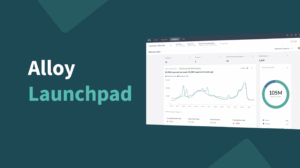
The Alloy.ai Launchpad
Distilling messy data from multiple sources starts here. See a video overview of Alloy.ai’s launchpad — a single hub for your sales and inventory performance,…

The Consumer Goods Guide to Modern Commerce
Everything a consumer brand needs to grow: sales channels, retail partnerships, eCommerce, omnichannel strategy, and operational playbooks — no fluff.

Marketing & Brand Building for Consumer Brands
Behind every great brand is great ops. Learn how to manage cash flow, set smart pricing, optimize margins, and build a supply chain that scales…