Performance Reporting
Automate Performance Reports.
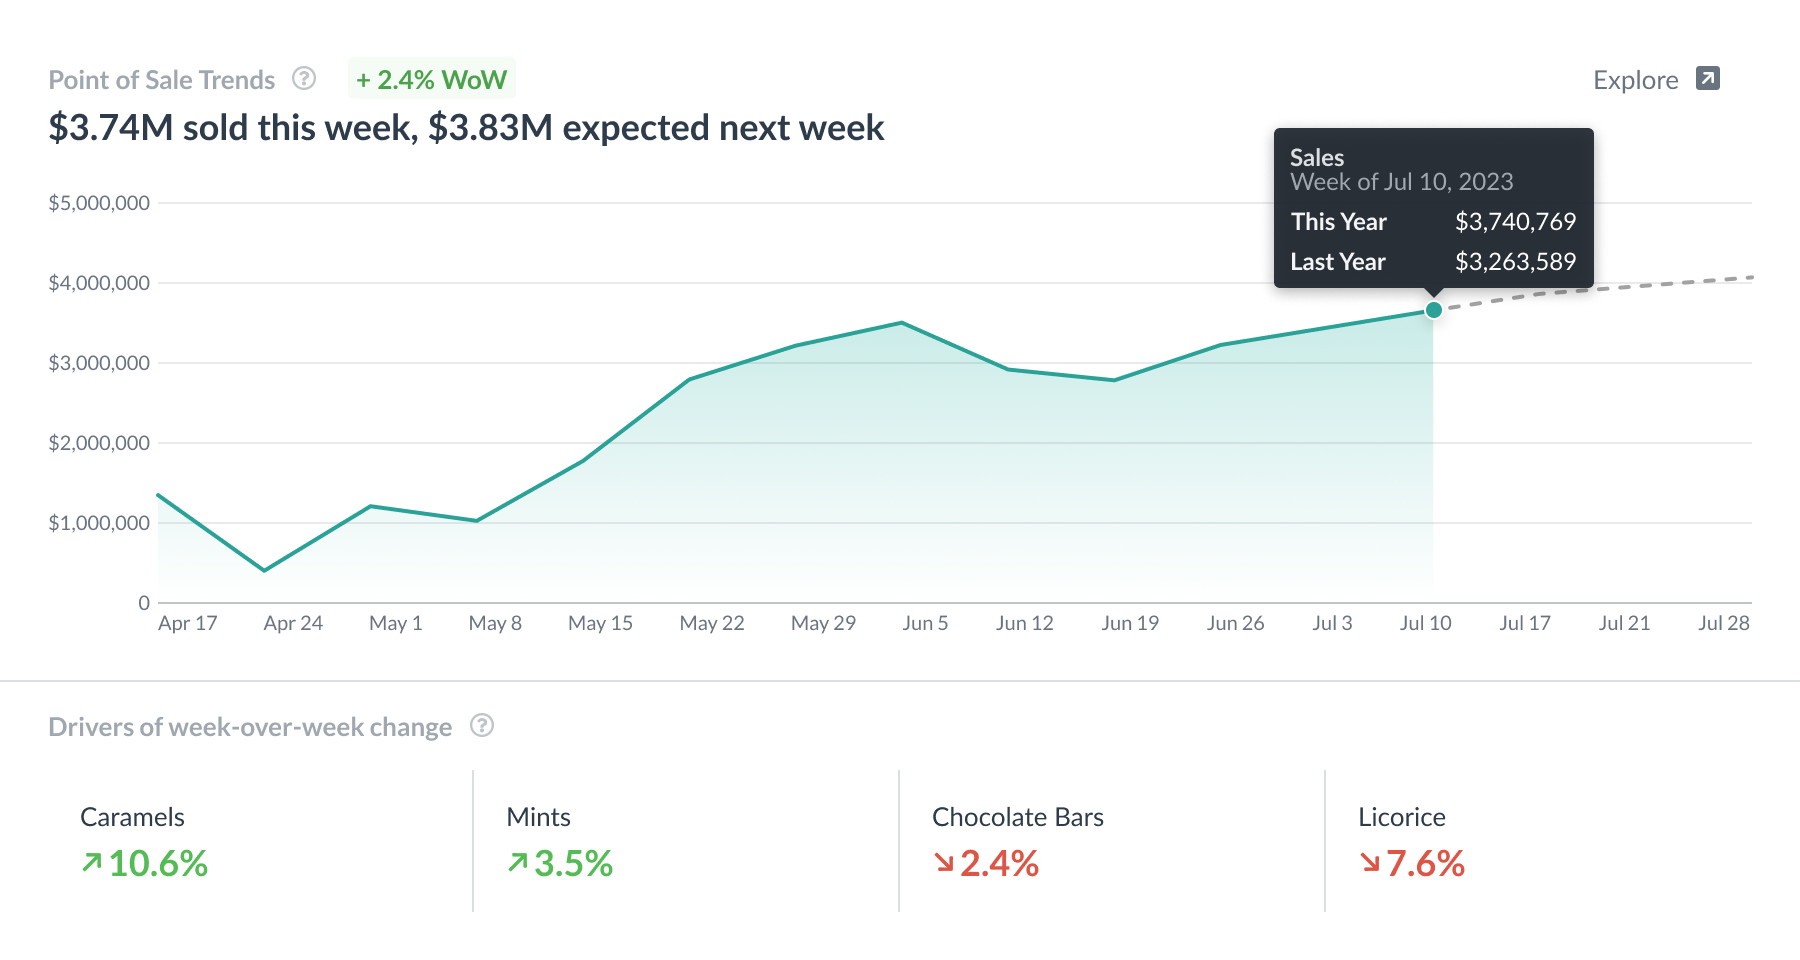
Performance sits at the intersection of your internal operations and external consumer demand. Alloy.ai captures this dynamic in real-time, ending the Monday scramble by surfacing your total business performance—from shipment to shelf—before you even log on.
TRUSTED BY THE WORLD’S TOP BRANDS


The Reporting Challenge
Win the Race Against the Clock
When insights depend on mismatched spreadsheets and the availability of analysts, your business is reactive by design. Waiting until noon for a fragmented view of last week’s performance means missing the window to course-correct or capitalize on trends. Alloy.ai delivers a unified view of your total business before your first meeting of the week begins—no human intervention required.
Built for Sales
Lead Every Internal and Commerce Partner Meeting
Own the commercial narrative, whether you’re reporting to leadership or meeting with a buyer. Alloy.ai provides near-real-time awareness to defend your sales plan internally and capture every growth opportunity externally.
-
Total Points of Distribution (TPD)
Monitor physical availability in real-time to ensure your assortment is reaching shoppers and no revenue is left on the table. -
Promotional Lift & ROI
Measure the true impact of trade spend instantly to optimize your future marketing calendar and double down on high-growth investments. -
Cross-Channel Rankings
Identify top-performing SKUs and commerce partners in seconds to capitalize on trends before they peak.


Built for Supply Chain
Identify Risks Before They Impact
Your Bottom Line
Proactive supply chain execution requires a direct link between demand signals and supply reality. Alloy.ai surfaces operational risks and unnecessary expenses before they hit your P&L, with no manual data assembly required.
-
Service Level and OTIF Monitoring
Track partner-specific service levels and weeks-of-supply to identify risks before they trigger costly expediting fees or partner penalties. -
Immediate Root-Cause Analysis
Determine instantly if a sales dip is a demand shift or an operational failure like Phantom Inventory. -
Unified Inventory Health
Access a single record of inventory-on-hand across your entire network, from your DCs to individual locations.
Built for Analysts
Scale Strategic Partnership Across
the Organization
Standardize your data foundation to eliminate the analytics bottleneck. Alloy.ai empowers your team to pivot between high-level snapshots and granular SKU-location level trends instantly.
-
Self-Service Personalization
Unlike rigid legacy dashboards, any user can modify and save their own views instantly. Pivot from high-level snapshots to granular SKU-location trends yourself—no vendor support tickets or coding required. -
Flexible Comparative Analysis
Toggle between 7-day snapshots and 13-week trends, or compare performance vs. last year and vs. plan in a single click. -
Automated Data Harmonization
Our data platform maps disparate signals into a clean, unified schema, removing the need for manual data cleaning, VLOOKUPs, or email-chasing. -
Management by Exception
Integrated workflows flag variances automatically, ensuring your team only spends time on the data that requires immediate action. -
Data Portability & Extensibility
Easily export clean, harmonized datasets to use in your own models or downstream tools, giving you the flexibility to combine commerce data with your internal systems.

Answers You Need
Performance Questions You Can Answer Instantly
Stop waiting for custom queries. Performance Reports provide immediate answers to the questions that drive your weekly execution:
- How is my total business performing vs. my sales plan and vs. last year?
- Which partners or SKUs are driving my over- or under-performance this week?
- What is the "lost sales" impact of recent out-of-stocks at specific locations?
- Which promotional events delivered the highest lift-over-baseline?
- Where is my inventory imbalanced across my omnichannel network?
FAQs
Everything you need to know about our product. Can’t find the answer you’re looking for? Reach out to our support team below.
Can I report using my own product categories, or do I have to use the retailer’s?
You get the best of both worlds. Alloy.ai maintains the integrity of raw retailer data, preserving their unique codes and descriptions so your team can speak the same language as your buyers during line reviews. However, for internal analysis, Alloy.ai automatically translates that data into your internal brand hierarchy, eliminates the manual VLOOKUP work usually required to compare performance across different retail partners, and gives you a unified view of your business instantly.
How flexible are reports in Alloy.ai? How can I build my own report?
Alloy.ai is designed for ultimate flexibility, allowing you to move from high-level executive overviews to granular, store-level data in seconds. The Home page will offer you a Launchpad of curated, best practice templates designed specifically for teams in the consumer goods industry. You aren’t locked into a single view; you can easily build, edit, and save your own widgets with the ability to view data as a table or visualize with charts and maps. Every report is interactive. If you see a sales dip in a national chart, you can click directly into that data point to “drill down” by retailer, by SKU, or even down to an individual store location.
Not only are you able to build your own reports, but you can also ask Lens, our AI-powered analyst, to do the work for you! Simply ask a question in plain English—like “Show me my top 10 underperforming SKUs at Target vs last year”—and Alloy.ai will instantly generate the visualization and report for you.
How does Alloy.ai facilitate comparison of sales and inventory performance across different retailers?
Alloy.ai automatically maps and links raw retailer product identifiers to your own Product Master language, enabling you to understand relative sales and inventory performance in a normalized language side-by-side, even when provided in different raw data sets.
What features does Alloy.ai provide to assist in identifying demand fluctuations?
Instead of hunting through spreadsheets, Alloy.ai’s demand sensing algorithms automatically surface insights and proactive alerts that flag unusual week-over-week sales deviations, spikes in demand, or sudden drops that could indicate phantom inventory.
What value or benefits can I expect from using POS Performance Reporting in Alloy.ai?
Improved operational efficiency, with the “Monday Morning Gift” of reclaiming hundreds of analyst hours per month. Instead of spending 25% of their time collecting and cleaning data in Excel, your team spends 100% of their time analyzing it and taking action. By eliminating Data Silos, your Sales, Marketing, and Supply Chain teams can work within a single source of truth, reducing internal friction and ensuring everyone is driving towards the same quarterly goals.
With a new ability to take action on Monday based on what happened last week, rather than waiting for a monthly post-mortem, you will be able to strengthen your retailer partnerships. No more walking into buyer meetings asking for information; you can now bring proactive insights. Retailers reward brands that can show them how to improve their category’s performance, leading to better shelf placement, and you will have hard proof for these conversations.
Book a Demo
See Alloy.ai
Synchronize execution to eliminate waste, mitigate risk, and capture every revenue opportunity.
Once you submit a demo request form:
- A sales rep will email you within 24 hours to schedule a brief intro call.
- Our team will provide an overview of Alloy.ai and learn more about your data goals and objectives.
- We’ll create and walk you through a live demo, customized to your specific data needs.