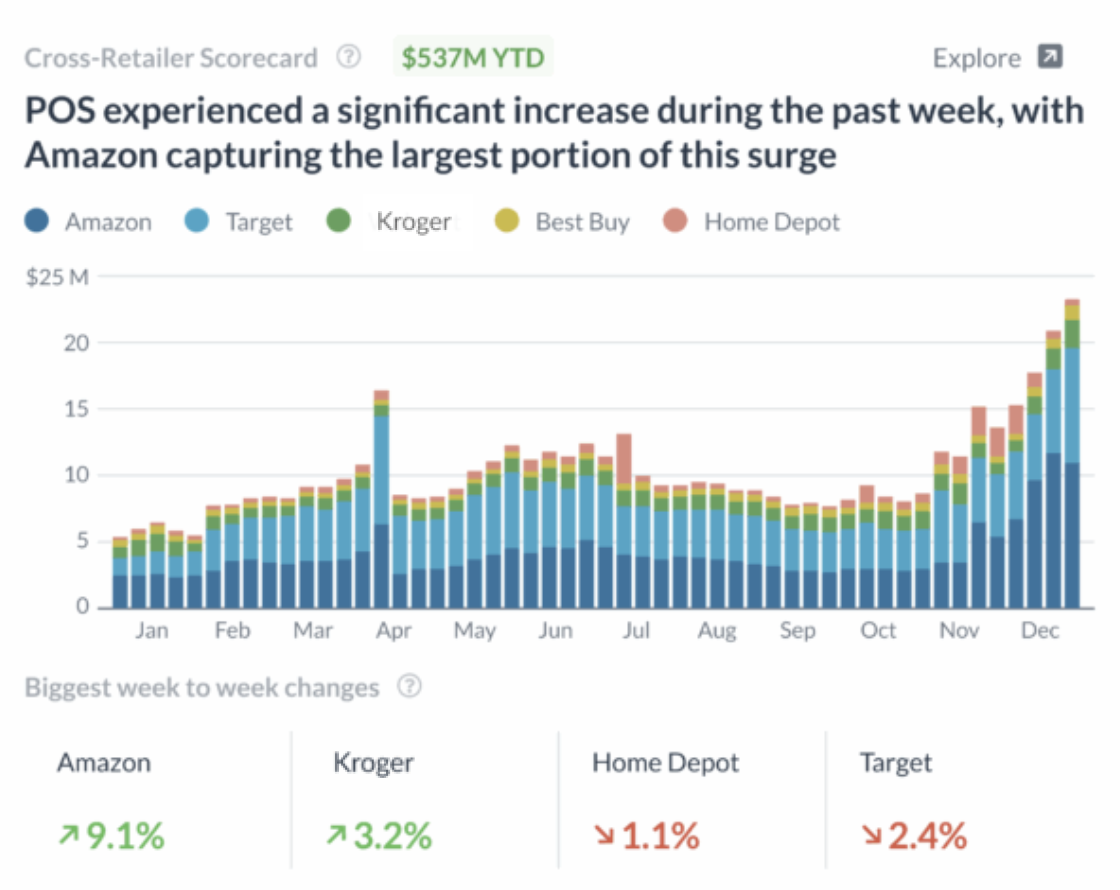
Cross-Retailer Scorecards in Alloy.ai
- Compare retailers with automatically mapped product IDs - Understand relative sales and inventory performance side-by-side between retailers with the help of automatically mapped and linked product identifiers.
- Access daily insights to take fast action - Act quickly on opportunities when retailers are under- or over-performing with daily and weekly performance insights surfaced for you.
- Stay on top of your key performance indicators - Track KPIs such as growth rates, weeks-of-supply, lost sales, in-stock percentage, margin, and retail price in aggregate or by a subset of partners.
- Understand the direction of your business with cross-channel trends - Slice and dice your retailer comparisons by channel types to better understand breakouts between brick-and-mortar, e-commerce, etc.
- Improve sales by isolating opportunities - Get alerted to when and how a retail partner is falling behind so that sales teams can manage by exception to improve sales.
What a Successful Retail Launch Looks Like
“What I find really helpful with Alloy.ai is it’s able to aggregate all the different retailer logins and pull that information in. In some of the retailers we were working with, we were getting Excel files. We weren’t even getting a real portal. What I love about [Alloy.ai] is I am able to look at the business across all the retailers and then really evaluate it.”

Larra Haftevani, Director of Retail Partnerships
Trusted by 100s of Consumer Brands

Harmonized retailer data at your fingertips
Get Started
Frequently Asked Questions
How does Alloy.ai facilitate comparison of sales and inventory performance across different retailers?
Alloy.ai automatically maps and links product identifiers across various retailers, enabling brands to understand relative sales and inventory performance side-by-side. This feature allows for seamless comparison of key performance indicators (KPIs) such as growth rates, weeks-of-supply, lost sales, in-stock percentage, margin, and retail price across different retail partners.
In what ways can brands utilize Alloy.ai's Cross-Retailer Scorecards to enhance sales performance?
The platform provides daily and weekly performance insights, allowing brands to act quickly on opportunities when retailers are under- or over-performing. Additionally, it offers alerts to notify sales teams when a retail partner is falling behind, enabling them to manage by exception and improve sales.
How can Alloy.ai's Cross-Retailer Scorecards assist in understanding business trends across different channels?
Alloy.ai allows brands to slice and dice retailer comparisons by channel types, such as brick-and-mortar and e-commerce. This functionality helps in understanding cross-channel trends and the direction of the business, providing valuable insights for strategic decision-making.