


The Role of Seasonality in Demand Forecasting Success
This article examines how to detect seasonality and various modeling methodologies to give you a head start in demand planning.

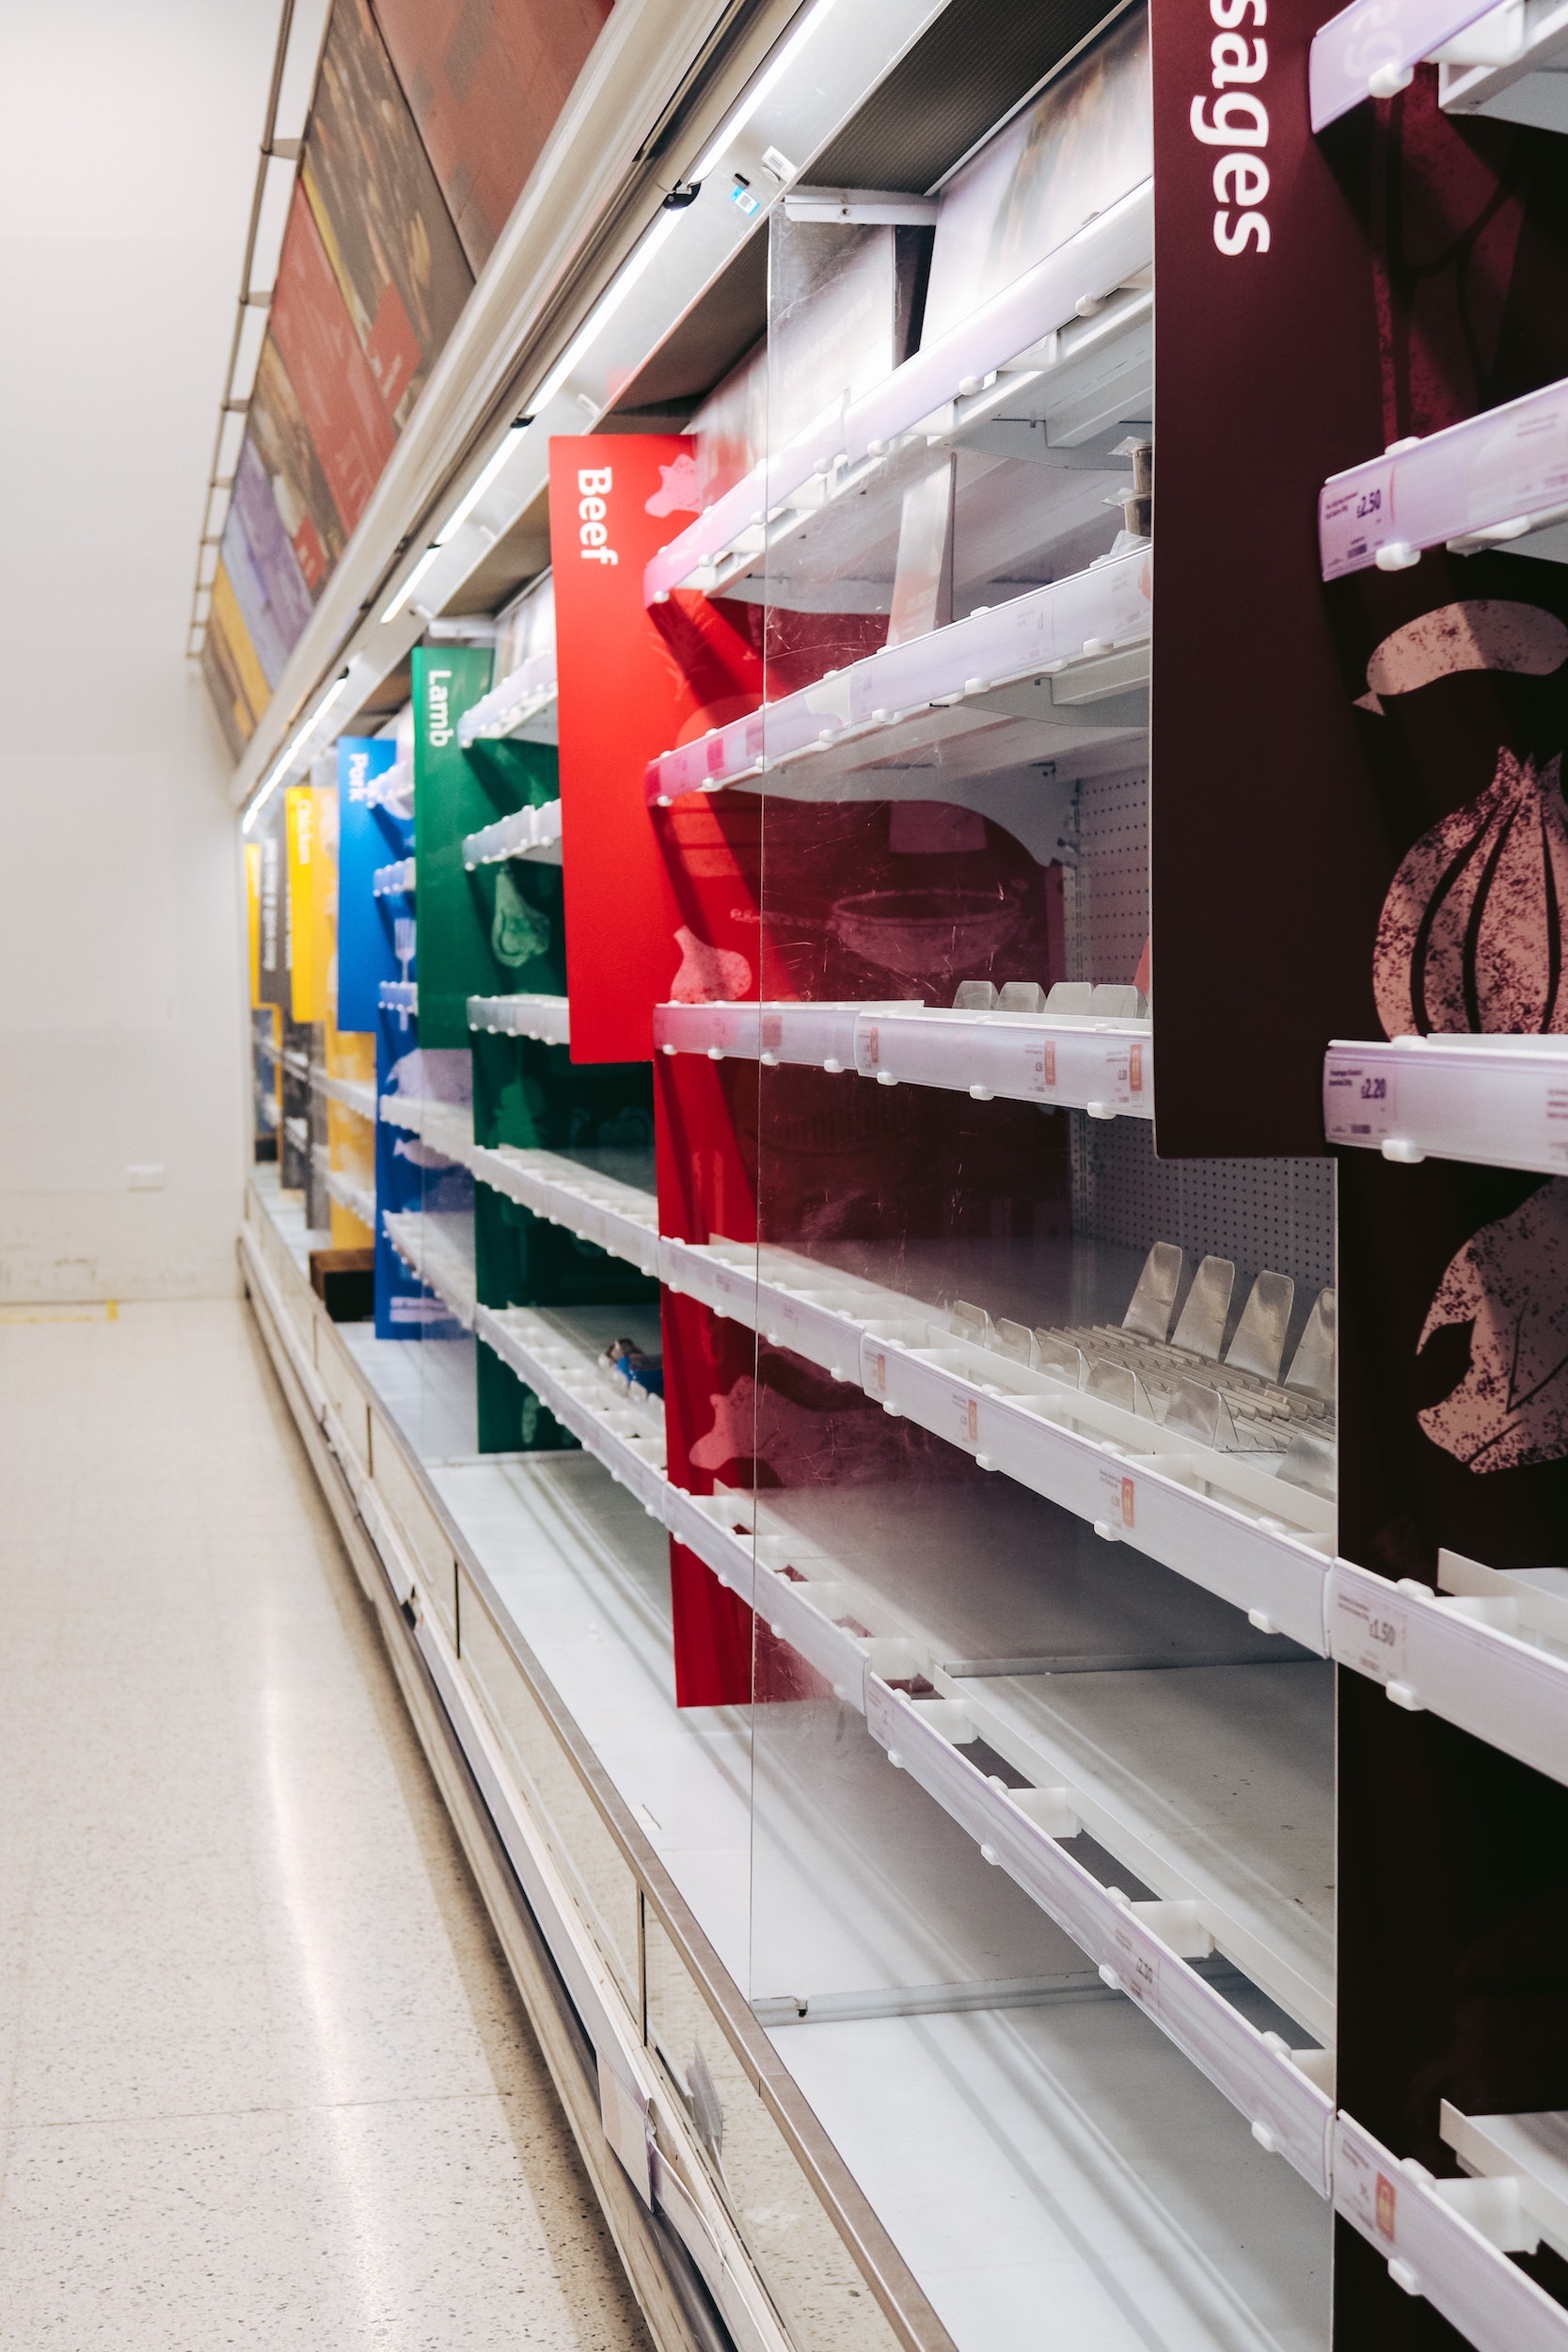
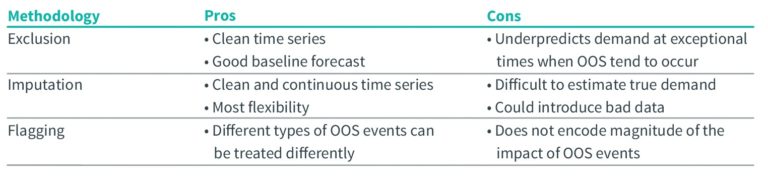
Look closer at out-of-stocks to improve forecast accuracy
To correctly account for historical out-of-stocks (OOS) in demand forecasting, examine the cause, product and location of each out-of-stock event.

Rise above your silos during business critical events
Learn concrete steps to target the most common sources of planning and execution errors, ensuring your peak consumer demand turns into dollars.