Guide

Seven steps to identify and prevent lost sales
Learn seven tips for never missing out on a sale due to out-of-stocks.
Keep readingWhen out-of-stocks occur, point-of-sale data, which is the basis for a good demand forecast, reflects lower demand than what consumers actually want to purchase. To keep from under-forecasting demand, you need to account for these events somehow in your data. There are three main options to do so, which we covered in a previous post.
Here we’ll describe situations in which you should use each method. Your chosen approach impacts the data you need and forecasting models you can use, which we’ll discuss too.
Getting this data preparation right might seem like a lot of work, but it helps ensure you’re using the best demand signals to build forecasts. Solutions like Alloy.ai can help, and it ultimately gives you a head start on preventing further short or late orders, out-of-stocks and lost sales.

Once you know when out-of-stock events occur, each method for incorporating it has benefits and drawbacks.
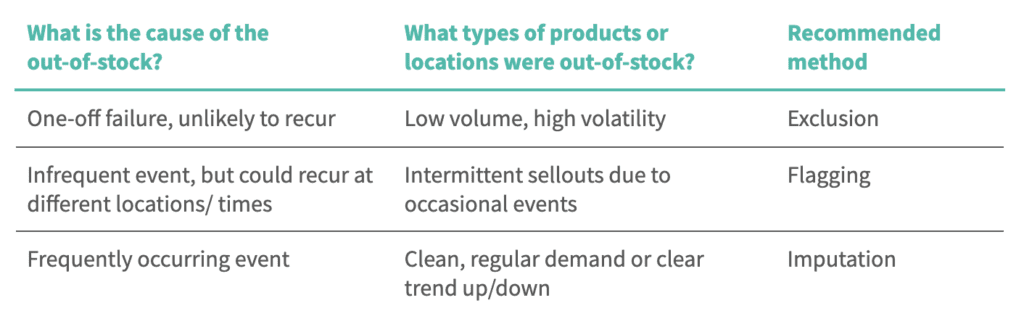
 What is the cause of the out-of-stock?
One of the first questions you should ask yourself when deciding between methods is causation. The reasons behind an out-of-stock range widely, from insufficient coordination between manufacturers and retailers, to extraordinary and unexpected demand, to supply issues.
Consider some sample scenarios:
Of course, a combination of scenarios could have caused your out-of-stocks. Ideally, you review each event separately and select the appropriate method for accounting for each one. Hybrid options combining multiple methods can also help balance out potential biases they each create.
You should also consider the actual products or locations in question because they impact how consumers react to the out-of-stock, and thus how important (and possible) it is to understand.
In general, imputation is ideal for products with regular demand, where it’s easy to track downward or upward sales trends.
Exclusion is the best option for low-volume products, such as new luxury items, and high volatility products, like non-tradable food. Because of the relative infrequency of out-of-stocks, it’s difficult to estimate their likely demand, and out-of-stocks are less valuable to understand more generally.
Flagging is applicable when out-of-stocks happen intermittently. Think of products or stores where demand is impacted by occasional events, like inclement weather or a local sporting event. With clear out-of-stock drivers, flags are useful for simulating future impact on demand when a similar event takes place.
After you’ve determined what method to use — exclusion, imputation, or flagging — you need to ensure you have the right data and forecasting models to support it. Best practice is to not let these factors determine how you account for out-of-stocks, and instead make your choice based on the characteristics of the out-of-stock, as we just described. You have options when it comes to getting the necessary data and building the forecast models, and it helps ensure your forecast reflects as close to true demand as possible.
If you’ve determined imputation is the right approach, your options are pretty open. It only requires aggregate sales data. As long as you have enough history, you can still make a good estimate of what true demand would be at all times. More granular data enables you to use similar locations and events to increase accuracy, but is not mandatory.
In addition, imputation leaves you with a clean, continuous time series. That gives you a lot of flexibility to apply different forecasting methodologies. The three primary classes of modeling methodologies – historical average, time series with added regressors and machine learning – can all work.
In contrast, because exclusion creates gaps in the data, you need to be very careful when using it. You should pinpoint specific out-of-stock events that are one-time anomalies to exclude, so it requires very granular store/SKU/day data. If the data is at a higher level, you could be inadvertently excluding good data from your input.
Furthermore, some historical average models, like exponential smoothing, don’t behave well with any data gaps and so cannot be used with exclusion. Similarly, time series models typically like repeatability (e.g. seasonality, last week/last year comparisons) to identify patterns. If you’re excluding a lot, it could cause sparsity in places where you are missing the reference data and limit the models you can use. Machine learning methods can still work, but generally the more data you have to feed into them the better, so exclusion is not ideal.
Like exclusion, flagging requires granular sales data so you can add the right categorical indicator variable to each out-of-stock occurrence; otherwise, you have to know what fraction of locations or products were out-of-stock. However, if you only have aggregate sales data, there may be ways to intelligently fill in the gaps and get to more granular data for the purpose of flagging.
In terms of forecasting models, flagging works well with both time series with added regressors and machine learning models. For example, seasonal ARIMAX models, which compare different historical time periods and take additional factors into account, can easily make use of the out-of-stock flag. Machine learning systems can easily incorporate flagged data into their models too. Some of the flagged events could cause a downward bias in the overall estimate and in this case, combining flagging with imputation can help correct for it.

There’s a lot to consider with out-of-stocks and how to clean up the data mess it creates. From the cause, product and location to data requirements and forecasting model implications, you’ll need to invest in this first step of a best-in-class forecasting process to improve your forecasts. Then your team will be in a stronger position to focus on managing by exception, catching when actuals deviate significantly from your demand plan and making the right adjustments.
Learn seven tips for never missing out on a sale due to out-of-stocks.
Keep readingWe discuss the three top methods for incorporating out-of-stocks in demand forecasting and the relative pros and cons of each.
Keep readingBring unbiased analytics to tricky allocation decisions to help maximize sales, keep customers happy and even prevent allocation situations.
Keep reading