

Article

Talking better product launch and allocation decisions with Ferrero USA
The global confectioner mitigates waste, improves service levels and controls costs by connecting digital supply chain visibility with POS analytics.
Keep readingWhen it comes to bringing insights to retailers, you can really stand out with rigorous measurement of marketing promotion effectiveness. Insights into what influences demand for your products are incredibly valuable to buyers as they may be more broadly applicable to the category, helping them better understand shoppers and manage their business. If they can rely on you for these learnings, you’ll become an invaluable partner.
However, too many suppliers simply look at sales performance during a promotion, compare it to the period before and draw a conclusion on its effectiveness. If sales went up, the promotion worked! Isn’t that what we’d all like to hear? In reality though, many other changes could have caused the sales increase, from the weather to a sale on a complementary product. It might have been your promotion, but if not, imagine what happens when you run the promo again and don’t get the same results. You could undermine your buyers’ trust – not to mention the dollars wasted.
Here we’ll outline an approach for measuring the ROI of marketing promotions that balances statistical sophistication with practicality, so you can get reliable results without a team of data scientists.
Too many suppliers simply look at sales performance during a promotion, compare it to the period before and draw a conclusion on its effectiveness.
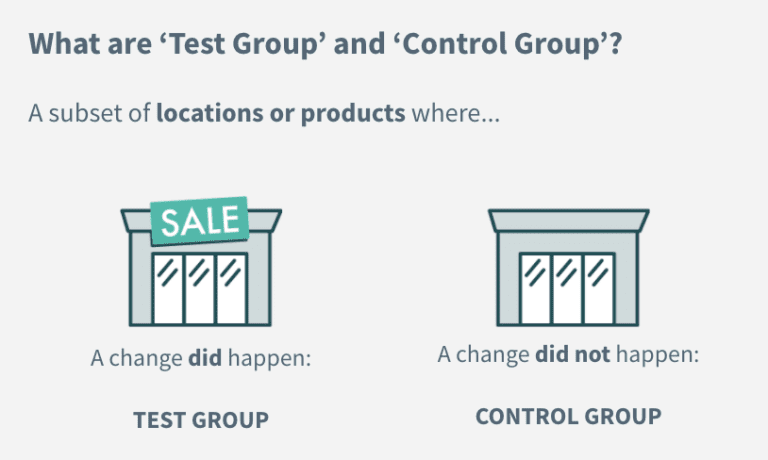
It can be applied to a wide variety of tactics we broadly refer to as “marketing promotions,” such as a price discount, circular promotion, end cap or other store display, or TV or out-of-home (OOH) campaign. Based on the concept of “test and learn,” we take a scientific approach to business experimentation by comparing a “test” group to a “control” group.
You need sell-through data to determine if a promotion had the intended effect on consumer sales. Customer orders don’t accurately reflect true demand, and are not what buyers care about.
This analysis requires store-level data so you can separate out “test” and “control” locations. It should also encompass every location, particularly if you’re trying to measure a promotion that a consumer could have seen regardless of what retailers they shop at, to capture the total effect.
This group of locations (stores, states, regions, etc.) is your “test group,” where a change happens. It’s a fairly straightforward step as long as you designed the promotion and kept records on it. If it’s a promotion that a retailer ran and didn’t provide you the specifics on, it’s a bit trickier, but you may still be able to identify what locations were impacted based on other indicators.
This group of locations is your “control group,” where a change does not happen. Correctly selecting your control group is critical to minimize bias. You want your control group to have a representative makeup of locations across key dimensions for a reasonable comparison. For example, if all the top performing stores are the test group, and all the bottom performers are the control group, that’s not fair!
Ideally, you design promotions with test-and-learn in mind. That means you purposefully hold back certain similar locations from running it to help measure effectiveness. You can still apply this approach if not, though. It may so happen certain locations didn’t have the promotion because of execution issues, or you can select another geography or group of retailers that has many similar characteristics as where the promotion was run. Put some thought into this decision and just understand the limitations of your choice, if any.
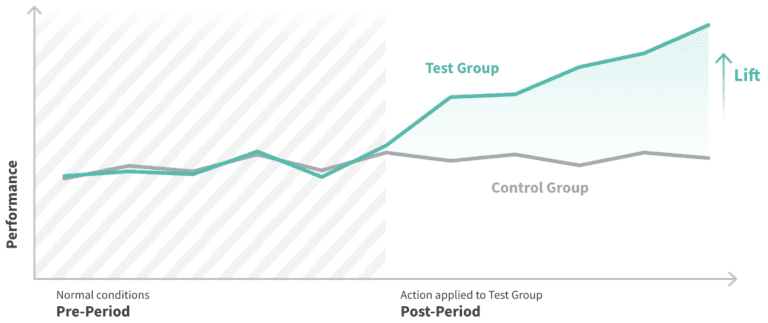
The change in sales is how you would expect your test locations to perform if they did not run the promotion. Say, your promotion is four weeks long. If sales during that period were 5% higher than the four weeks before the promotion, you can assume that your test locations would have otherwise seen a 5% increase in sales too.
Using the same time periods as in the last step, determine total sales for the test locations leading up to the promotion and while it took place. The dollar value difference is the change in sales you realized from the combined impact of the promotion and other factors that would have also affected the control group.
Here’s the exciting part! Determine the difference between your actual sales for the test group, and expected sales based on the control group. Continuing the above example, say sales for the test group were $1,132 in the four weeks before the promo. Applying the percentage increase in sales from the control group (36%), we would expect sales during the four week promo to be $1,540. Sales actually totaled $3,703. That difference of $2,163 is the isolated incremental impact of the entire promotion!
You may want to further break down this overall impact number by week, product or store to see if the impact was uneven. Perhaps almost all the increase came from the first two weeks. You now have an actionable learning for the next time you run a similar promo.
You can also translate this dollar figure into a sales lift % by dividing the impact by the expected sales. In this case, it’s about 140%! Lift percentages are particularly useful when you’re comparing multiple promotions to understand their relative effectiveness.
The final step in your analysis is to determine the ROI, given your investment to run the promotion. Even a promo with a positive impact can have a negative return if it was expensive to run.
Once you’ve learned what does (or does not) drive an increase in sales, make sure to relay your data-driven recommendations back to your retail buyer in a timely manner. That could mean as soon as the promo is over or even mid-way through, when there’s still opportunity to make adjustments to increase its impact.
Use the data to shape the story you tell. Even if a promotion doesn’t deliver the lift you had discussed, proactively sharing the information and learnings builds trust. Your buyer will know they can count on you for sound analyses and feel confident in your results the next time you come back with a high impact number!
The global confectioner mitigates waste, improves service levels and controls costs by connecting digital supply chain visibility with POS analytics.
Keep readingHow to take an iterative approach to digital supply chain transformation with real-time alerts that motivate teams to collaborate on issue resolution
Keep readingUnderstand how gaps between systems, teams and processes are keeping you constantly firefighting and hurting your supply chain resilience
Keep reading