One of the regular asks we see from our customers is to include weather metrics in Alloy. Weather data can help better understand historical disruptions to businesses like shipping delays or store closings caused by extreme weather. It also helps understand seasonality better. In this article, we discuss how we’ve implemented weather data leveraging BigQuery.
NOAA Time Like the Present
As BigQuery has grown and matured, Google has worked with data partners to convert data that’s already publicly available elsewhere into BigQuery public datasets that can be easily queried by any BigQuery instance. The one we’re using in particular is the National Oceanic and Atmospheric Administration’s (NOAA) Global Surface Summary of the Day (GSOD).
Typically when we’ve had the request for weather data, the particular types are similar to what you’d look for when you’re checking the local weather:
Temperature: min, max, average and how they are changing over time,
Rain and snowfall and periods where they accumulate, and
Extreme weather events (e.g. hurricanes and tornadoes)
Fortunately, the GSOD data in BigQuery has most of this data available. There is data covering the last 90 years!
Querying Weather Data with BigQuery
Given the simplicity of working with BigQuery, it’s trivial to try things out! For example, you can write a simple query to find the range of temperatures for any day of the year:
SELECT date, MAX(temp), MIN(temp) from `bigquery-public-data.noaa_gsod.gsod2021` GROUP BY date;
One thing you’ll notice with this particular dataset is that the tables are separated by year, which could create a really annoying query to be able to look at year-over-year weather trends. Fortunately, BigQuery has a neat table wildcard query operation to handle this. The query above can be easily modified to do the same analysis over the last 2 years:
SELECT date, MAX(temp), MIN(temp)
FROM `bigquery-public-data.noaa_gsod.gsod20*` WHERE
_TABLE_SUFFIX BETWEEN '20' AND '21'
GROUP BY date
Note that if you’re looking to go further back, the date field is not available and you have to query year, mo, and day. The query will not fail, but it won’t return results for those earlier time periods.
The goal is not to build a Weather Underground competitor, but to find a way to effectively combine weather data with all the metrics that are already available in Alloy – like sales, Out-of-stocks and so on.
From Proof of Concept to Production
Most of the metric data in Alloy is stored as a timeseries keyed on product (e.g. UPC) and location identifiers (e.g. Walmart Store #225). Because users can do analysis at this product-location level granularity, this means that we’ll need to map the weather details to each of these locations.
BigQuery has support for a set of geographic functions where we can find the nearest station by latitude and longitude using the ST_GEOPOINT function. While there are many ways to interpolate temperature data, we found that most of our locations have a weather station within 100 km and since most typical analysis will be done at the location level to identify the impact of weather, the exact interpolation is not that important and is unlikely to affect our users’ analyses in a substantial way. There are always real-world exceptions like microclimates, but this gets us pretty far along.
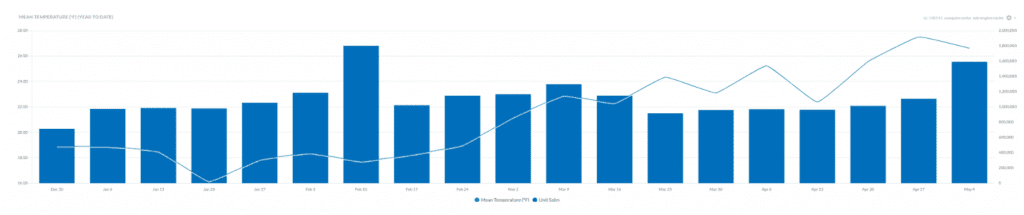
Now with the mapping to the rest of our data, we can execute a simple query where we can see how a change in temperature is affecting sales over time. When writing the query, a simple join operation on the location and date can be applied to add these new weather metrics into our queries and take advantage of the query optimization and caching available in BigQuery. Converting the queries and table references using jOOQ, we can keep them type safe and easily reference them when extending the data to other applications.
Comparison of Sales performance vs temperature
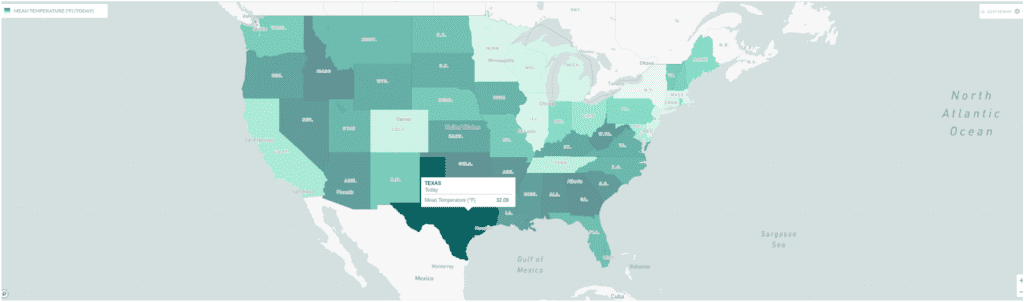
Seeing data at individual location granularity is important for the weather use case, but seeing trends at a regional level can help zoom out and see the big picture. The Alloy platform allows for aggregations (min, max, average) at any level, which has an interesting side effect to see something like the average temperatures for different products which would indicate if they’re more likely to be sold during cooler months or places that are in warmer areas.
Average mean temperature by state
Conclusions
The one additional use case for weather that is always a secondary question is around using weather to help forecast sales or out-of-stock events. While it’s clear that weather is a causal driver of sales, the time horizon for precise weather forecasts (usually 1-2 weeks, see the NOAA forecast dataset in BigQuery) is much shorter than the typical demand planning horizon that can be weeks or months. This is a case where correlation wins over causation and using annual seasonality is a good annual proxy for weather, outside of extreme weather events.
The accessibility of interesting datasets, such as weather, in BigQuery make it very easy to take new data sources from ideation into production within a broader application and can be a great way to get validation and usage before any greater investment in infrastructure needs to be made. The Google BigQuery marketplace has continued to grow with new datasets and once you’ve implemented one, building the next ones is straightforward.
About the Author:
Franklin Morris
Franklin Morris is Vice President and Head of Global Marketing at Alloy.ai. He's spent his career leading brand, content and demand generation marketing for high-growth startups, ad agencies, and Fortune 50 giants, including IBM, Dell, Oracle, Rackspace, 3M, Facebook, Electronic Arts, Informatica, Sisense, and Argo Group.