Webinar recap: How toy companies can use analytics to drive retail sales
Date Posted: September 27, 2019Author: Franklin Morris
Logan Ensign
Earlier this month, Alloy collaborated with The Toy Association for a webinar on the necessity of granular POS and inventory analytics to grow your business. We joined The Toy Association earlier this year, and are eager to help our fellow members grow their businesses by sharing the insights we’ve learned working with innovative toy brands.
The webinar was moderated by Anne McConnell, Senior Director of Market Research & Data Strategy at The Toy Association, and hosted by Logan Ensign, our Director of Client Solutions. Logan works closely with many of Alloy’s customers to share best practices and help maximize the value they receive from Alloy.
Logan started by discussing how even in a market overshadowed by e-commerce institutions like Amazon, retail will always play an integral role for toy companies. Quoting Toys “R” Us joint venture interim co-CEO Phillip Raub, “As the retail landscape changes, so do consumer shopping habits. But what hasn’t changed is that kids want to touch everything and simply play.”
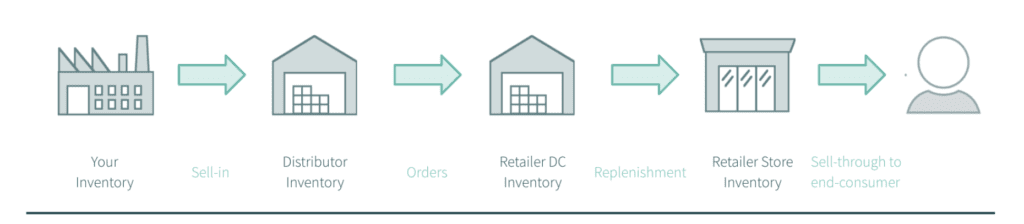
While brick-and-mortar retail is an integral component of the industry, manufacturers who work with retailers and distributors know efficient supply chain management requires a great degree of coordination; you need to effectively communicate across data and organizational silos to drive sales and grow distribution. Some of the common challenges we’ve seen across industries include:
Understanding consumer demand. Because the data is spread across all your retailers, simply bringing it all together for analysis is often a painful effort.
Aligning inventory to demand. Similarly, because the inventory sits outside your own four walls, it can be very hard to get a complete picture of whether it’s in the right place, at the right time to optimize inventory management.
Influencing retailers. Say you’ve figured out what products should be where, you still need to get your partners on board to execute upon your insights.
Responding to opportunities quickly. During peak seasons, a day or two delay can translate to significant swings in sales.
Below, we’ve summarized the key points from the webinar on how you can overcome these challenges to take control of retail sales. If you’d like to view the full recording and download the presentation slides, they are available on The Toy Association website (membership required).
Challenge #1 Understand sell-through and true demand
For companies used to selling direct-to-consumer, a critical difference to understand with retailers is sell-in vs. sell-through (also sometimes referred to as sell-out). Sell-in is the amount of product that the retailer orders, whereas sell-through encapsulates what consumers actually buy at the cash register.
Sell-through is what manufacturers should care about—the transactions at the point-of-sale. You can’t count on retailer orders to match end consumer demand, and if a mistake is made, you likely end up paying for it. An order that’s too low, and you could be facing lost sales. An order that’s too high, and you’ll be hit with costly returns.
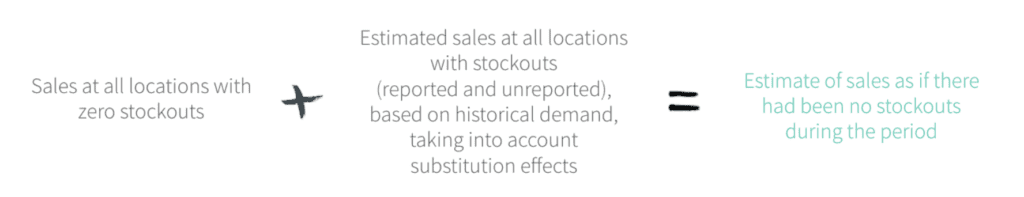
However, sell-through doesn’t tell the full story, either. Where your teams should really be focused is true demand, which doesn’t always match sell-through due to out-of-stocks. Using true demand for demand forecasting will help increase your forecast accuracy and prevent artificially low forecasts due to depressed sell-through.
“Make sure you’re looking at what was selling at the cash register, but also if you didn’t have any out-of-stocks, what would you have sold? If you’re always running out of product, but you’re not adjusting forecast based on that out-of-stock, you’re going to continue to run out of product in the future.”
True demand is calculated by adding 1) your sales at all locations with zero stock-outs and 2) your estimated sales at all locations with stock-outs. It sounds simple, but accurately estimating the hypothetical situation of what sales would have been if the product was on the shelf requires taking a hard look at historical demand and substitution effects.
Calculating true demand
Challenge #2 Align inventory to demand
Of course, demand is only half the equation. You also need to understand what’s happening with supply to be able to optimize inventory levels and manage product allocation. As you would expect, that’s also not as straightforward as it sounds either.
A complete picture of inventory includes:
Units on hand at every retail store and DC
Units in transit between your warehouses and retailer DCs, and
Units on order where the product has not shipped yet
Putting all these pieces together often means connecting data from multiple systems and sources. It gets more complicated the more tiers there are in your network.
However, the result of combining that with true demand leads to very powerful insights.
For example, it enables you to isolate issues like phantom inventory—one of the most “costly challenges that manufacturers face.”
“This is when a store reports that a product is on-hand, but it isn’t actually available for sale. Their systems are saying the product’s here, but in reality that product is not on the shelf. This is an issue that is particularly costly because no automated system is catching this. It can persist a long time and result in lots of lost sales.”
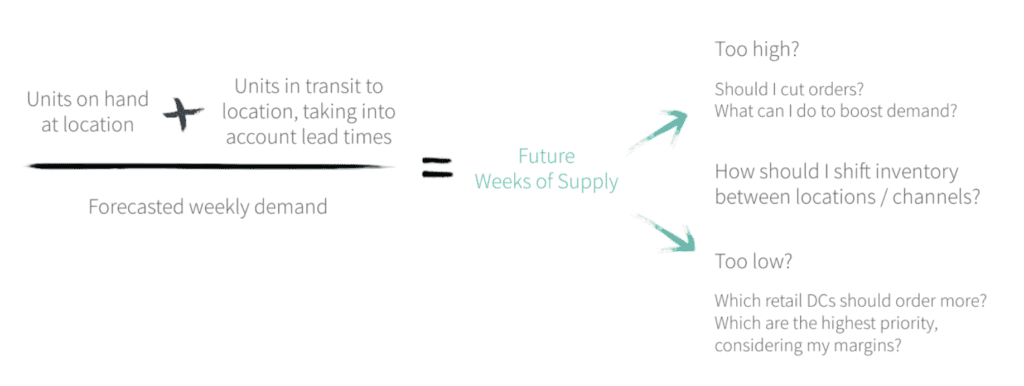
The combination of true demand and a complete inventory picture also enables you to calculate the Weeks of Supply at each location in your supply chain. This single metric can reflect the health of your supply chain and help you quickly pinpoint where problems exist. It provides insight into how much inventory coverage manufacturers have at a store, DC, or warehouse, given the likely demand at that location or the locations that pull inventory from it.
With granular, location-level detail, you can develop actionable strategies based on whether Weeks of Supply are too high or too low, and better allocate product across all your locations to increase inventory productivity.
Challenge #3 Influence retailers
All the data and insights described above have little impact on sales if retailers can’t be convinced to adjust their ordering and replenishment strategies accordingly. Ultimately, retailers control what goes on their shelves. Only if you can influence them can you take greater control of the supply chain and your retail sales.
Here are a few tips we’ve seen help companies large and small influence major retailers to execute upon their insights.
Speak their language
Each retailer has their own calendar weeks, product IDs, costs of goods sold, gross margins, service level targets, and more. Communicating in terms that they use, instead of your own internal language, can help expedite the process and ensure seamless understanding.
Make detailed recommendations
Instead of providing vague or theoretical suggestions at the account level, deliver recommendations that are backed by data, along with a strategy for execution at the location level. For example, identify a specific DC that is projected to have insufficient inventory to meet demand (Weeks of Supply are too low). Drill down to show the stores with out-of-stocks and in need of additional inventory and recommend exactly how much the retailer should order to be sent to that DC.
Show what the data means to them
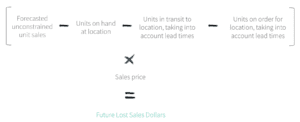
Quantify how retailers will benefit; show them how much more money they could make if they took your recommendation. One of the most effective metrics you can show them in this regard is Lost Sales Dollars. It quantifies how much they’re losing by not listening to you.
Lost sales is calculated by looking at true demand, and finding the gap between that demand and the inventory that will be available, i.e., the sum of what’s available, in transit, and on order.
Calculating lost sales
Communicating this dollar figure will “result in more action and a more meaningful conversation,” Logan said. “You want to be able to quantify future issues and opportunities for the retailer. That can lead to a much more compelling conversation.”
Challenge #4 React quickly
Furthermore, this data and insight also isn’t valuable unless you can respond quickly, while the opportunity to make an impact on sales still exists. Response time is especially important for toy companies, whose sales are typically very seasonal, and the difference between December 24 and December 26 can be “enormously costly.”
To help ensure that your team is ready to respond quickly to changing demand:
Automate where possible
When you think about all the data we just discussed—sales, orders, inventory, etc.—and multiply it by the number of SKUs you have and the number of stores carrying inventory, it easily results in millions of data points on a weekly basis. This amount of information is just too unwieldy for your team to manage manually. As you think of how to approach data and retail analytics, consider how to make this scalable and automated.
Manage by exception
Similarly, the potential insights from all this data can get overwhelming. To find the areas that your team should focus on and action, employ an approach that highlights “exceptions”— situations where performance has deviated outside acceptable thresholds, like Weeks of Supply below 4 weeks (depending on your lead times). Management by exception will help ensure you are strategically prioritizing the top issues and opportunities, not just firefighting all the time.
With the right framework and tools for analysis, you can navigate the challenges of selling through retailers to take control of your supply chain and drive sales. Solve problems like recurring out-of-stock cycles, phantom inventory, and expensive returns, among others.
To see how Alloy’s cloud solution addresses these issues to deliver top and bottom line growth for consumer goods brands, schedule a demo today.
About the Author:
Franklin Morris
Franklin Morris is Vice President and Head of Global Marketing at Alloy.ai. He's spent his career leading brand, content and demand generation marketing for high-growth startups, ad agencies, and Fortune 50 giants, including IBM, Dell, Oracle, Rackspace, 3M, Facebook, Electronic Arts, Informatica, Sisense, and Argo Group.