
Alloy.ai Consumer Goods Index – July 2023 Edition
Deltas in sales over time and inventory totals are critical leading indicators for the health of the consumer goods industry. Retailers and consumers alike are impacted by deviations and volatility in the consumer goods supply chain. The Alloy.ai Consumer Goods Index tracks 40M SKU-location combinations across both retail and ecommerce, giving a view into sales and inventory trends across industries. Use this data to understand the trends, isolate the impact of wide-scale events and predict future peaks and valleys.
Note: All consumer goods data within this dashboard has been generalized to protect the anonymity of the companies involved.
Table of contents
Alloy.ai Consumer Goods Index — July, 2023
Consumer goods trends in July 2023
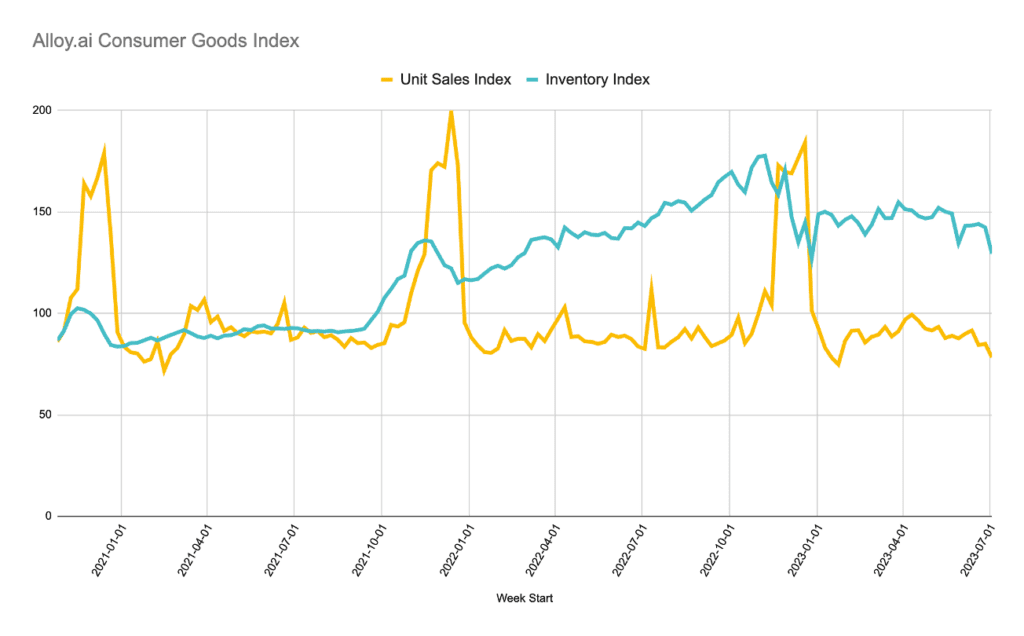
Precipitous drop in unit sales over the quarter
Unit sales during the month of June were 9% lower than during the month of April. This may be attributable to seasonality, as a 7.7% drop was seen over the same period in 2022. This decline in unit sales aligns with what is being reported in the media as consumers rein in their spending against heightened inflation even as we experience a robust and resilient labor market.
Excess retail inventory rates continue to trend downward
Average inventory rates declined 4% during the most recent quarter from April – June. While it is good news to see this downward trend, the industry as a whole is still recuperating from Covid-era inventory buildup and rates remain high. Ongoing excess inventory issues are still contributing to lower-than-expected earnings for retailers as events and promotions are run to reduce stock and procurement teams hedge their bets by replenishing products in the last moments.