
Alloy.ai Consumer Goods Index – June 2023 Edition
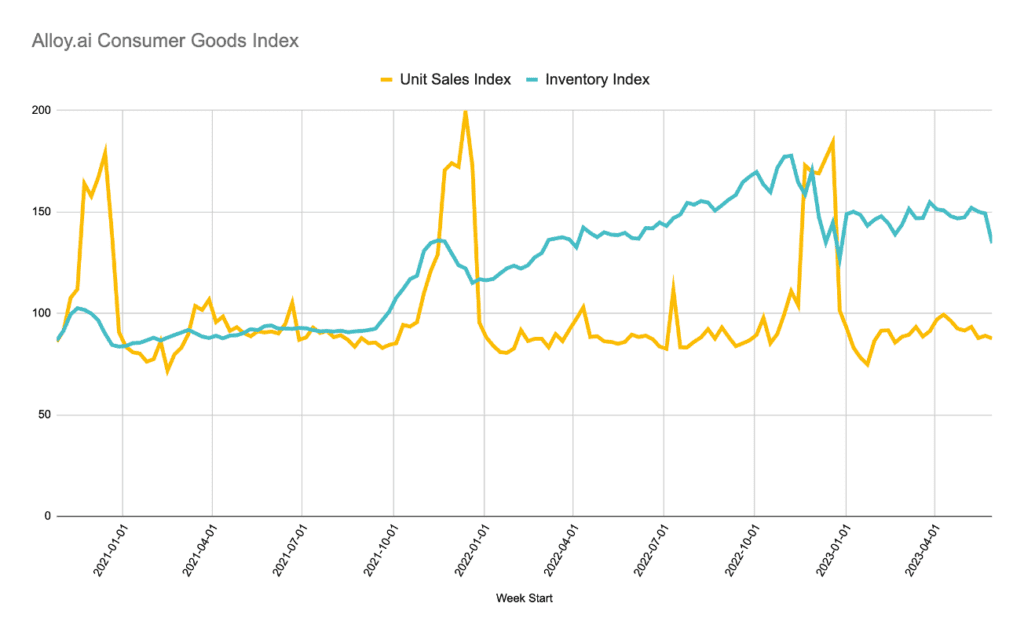
Deltas in sales over time and inventory totals are critical leading indicators for the health of the consumer goods industry. Retailers and consumers alike are impacted by deviations and volatility in the consumer goods supply chain. The Alloy.ai Consumer Goods Index tracks 40M SKU-location combinations across both retail and ecommerce, giving a view into sales and inventory trends across industries. Use this data to understand the trends, isolate the impact of wide-scale events and predict future peaks and valleys.
Note: All consumer goods data within this dashboard has been generalized to protect the anonymity of the companies involved.
Table of contents
Alloy.ai Consumer Goods Index — June, 2023
Consumer goods trends in June 2023
Month-over-month unit sales declined
Unit sales during the month of May were more than 6% lower than during the month of April. This decrease eliminates the positive gains seen between March and April, bringing the average back down to March levels. YoY unit sales are up nearly 4%, bringing average unit sales back on par with the average seen during the same month in 2021. This sudden drop in unit sales is in line with what is being reported in the media as we approach a potential recession and consumers rein in their spending.
Inventory rates are declining, heralding possible relief for constrained supply chains
Average inventory rates during the month of May 2023 were on par with April 2023. However during the last week of the month in May, the inventory index dropped from the YTD average of 147 down to 135. This is a low not seen since the tail-end of the 2022 holiday shopping season after many retailers used sales and promotions to move excess inventory. Ongoing excess inventory issues are contributing to lower-than-expected earnings for retailers and brands alike as costs are passed along to consumers.