- Manfred Reiche
Timely and granular retailer data are must-haves for supplier brands to increase sales and maintain customer service levels while controlling costs. Point-of-sale and inventory details aren’t just helpful; they’re the key ingredient to growing market share and staying ahead of competitors.
Most retailers offer some point-of-sale reports, but the metrics and level of granularity can range quite a bit, sometimes failing to paint a complete picture. That’s why we’re sharing how some of the biggest retailers provide data, and how you can try to make up for the gaps. So far, we’ve offered breakdowns of Amazon Retail Analytics and The Home Depot. Today, we’re looking into Sephora, the popular cosmetics and beauty chain. It presents some real hurdles when it comes to forming a complete understanding of your performance.
We work with a number of health and beauty brands, many of which sell through Sephora. For example, Youth to the People is a clean skincare brand that has broad distribution and a really strong relationship with the retailer. They rely on up-to-date, store/SKU performance data to enable field sales and optimize operations to keep up with fast-changing consumer demand.
Sephora Data Options and Types
Brands selling through Sephora in the United States have two options for point-of-sale data.
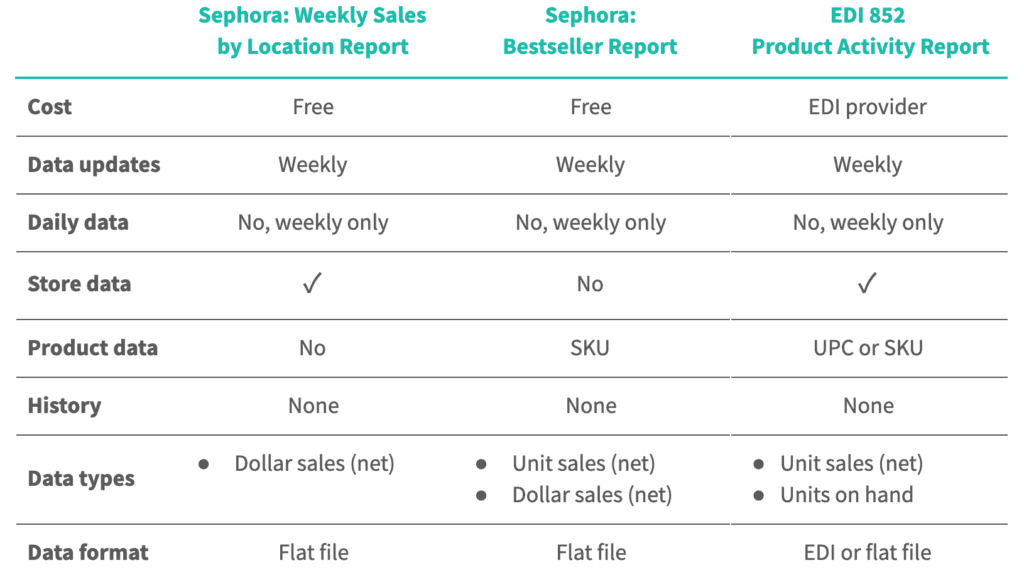
The first is the retailer itself. Sephora directly provides two spreadsheet reports to brands: 1) the Weekly Sales by Location Report and 2) the Bestseller Report. The Weekly Sales by Location Report states your net sales dollars at each Sephora store, but doesn’t break down sales by SKU. The Bestseller Report shows both sales units and sales dollars, broken out by SKU, but is aggregated across all stores.
The second is the EDI 852 Product Activity Report. You can receive it from an EDI provider, such as SPS Commerce, which charges a fee. The report provides net sales units and on-hand units, down to a store and SKU level, but provides no data in dollar terms.

Which report should I use and when?
Depending on what information you need, we recommend focusing on different reports:
- If you’re only interested in unit volume—not dollars—the Product Activity report is your best resource. It provides unit data at a granular, SKU-store level. Because it includes inventory on hand as well, it guarantees accurate insight into key metrics such as in-stock %.
- If you’re looking for specific geographic information, such as to evaluate field sales performance, the Weekly Sales by Location report is ideal. It provides dollar sales by location, not estimates, so it is also very useful for conversations with Sephora store teams.
However, no report is perfect; there are shortcomings to all the options.
If you’re looking at just the two reports provided by Sephora, you’re left with a big question. Which products are selling (or not selling) at which specific retail locations? You can know how specific products are selling, or how specific store locations are performing, but never the combination of both product and store.
This lack of detail makes it difficult to gauge geographic sales trends of products or product categories, compare the performance of specific products at one store to another store, and to ultimately strategize more nuanced sales and supply chain management strategies. For example, the data doesn’t give your field sales teams the insights they need to make recommendations to the Sephora store team on which products to push. This drawback also makes strategizing new product launches difficult. You can’t tell where a new product is performing well and where you need to invest to boost sales.

The EDI Product Activity Report is much better in that it does provide store-SKU granularity, so you know how many of each SKU is selling at each store. It is still an incomplete picture, though, as you don’t know dollar sales at the SKU-store level. Knowing the dollar value of your sales enables you to prioritize effectively based on the value of the business, not just volume, so you can focus your time and resources where they’ll make the biggest revenue impact.
However, no report is perfect; there are shortcomings to all the options.
So, where does all this leave you? Frustrated with one thing. Sifting through three different reports to cherry-pick different metrics is less than ideal—it’s time-consuming and clunky, only giving you the pieces of the puzzle to form a clear picture, when you should be able to get the picture itself. We feel the same way; you should only have to focus on how your skin scrub’s selling instead of scrubbing through streams of data (in different data formats, no less).
Putting the Pieces Together
Let’s see if we can… “makeup” (get it?) a way to configure this data to provide a clearer understanding of how you’re selling at Sephora. Through combining these three data options—EDI Product Activity Reports, Bestseller Reports, and Weekly Sales by Location Reports—you can come up with a more holistic overview of your performance at Sephora. In other words, you can get a good estimate of your dollar sales by store and by SKU to supplement what’s provided directly.
The Bestseller Report provides unit sales and dollar sales, so you can use it to calculate the average price per product each week. This average retail price can be applied to the data in the Product Activity Report to derive sales dollars at the SKU-store level, as well as the sales value of on-hand inventory. It can also unlock value-added metrics, like lost sales dollars of any out-of-stocks (when units on hand are zero), when combined with forecasted sales at that location.
Keep in mind, these numbers are only estimates. Since you don’t receive price information by geography from Sephora, you must assume prices are consistent across stores in this instance.
Another limitation of this data is that it’s provided at the weekly level only, across all reports. Lacking daily insight makes it harder to optimize your operations, such as replenishment models or field sales visits. If you also sell through other retailers and they provide daily data, you can use their sales patterns to infer daily sales at Sephora, and then compare daily performance.
Dive Deeper
As discussed, the value of up-to-date, granular data can’t be overstated, with applications ranging from inventory management to sales insights and demand planning. But it can be a lot of work managing it all, especially across multiple retailers, to get a complete picture of your business. Here’s where Alloy.ai can help overcome common challenges beauty brands face to meet daily and weekly sales goals, maximize promotion performance, and maintain brand loyalty.
Touch base to schedule a demo and see how our integrated platform can help you stand out to retailers and consumers.

Manfred Reiche
Manfred Reiche is Alloy.ai‘s subject matter expert on all things related to retail data and products. He spent his time at Alloy.ai being hands-on with some of our most sophisticated brands in the consumer goods industry. Prior to joining us at Alloy.ai, Manfred started his career as a technical consultant at Deloitte, focused on SAP implementations.

Cross-Retailer Scorecard Demo – Monitoring Inventory & Sales Trends Across Retailers
Watch Alloy.ai’s Cross-Retailer Scorecard demo to compare retailer performance weekly, spot outliers fast, and drill from partner to location to SKU to act fast.

Lowe’s Vendor Portal Guide 2025: Mastering Onboarding and Portal Integration
Master Lowe’s Vendor Gateway and Vendor Portal (LowesLink) in 2025. This guide offers essential tips, FAQs, and strategies to enhance your onboarding and business management.

How Edgewell Drove $4M in New Sales and Made Smarter Inventory Decisions
Edgewell used Alloy.ai to optimize inventory, resolve phantom stock issues, and drive $4M in new sales, transforming data into actionable supply chain insights.

