Consumer goods companies who sell through retail face a variety of interconnected pressures:
Chaos in manufacturing and logistics putting substantial pressure on margins and constricting supply
Increasing competition in an increasingly global market with more markets and ways to sell
Increasing service expectations from retailers engaged in a convenience arms race with Amazon
And the phenomenon driving it all — accelerating consumer behavior shifts.
And all of that was even before COVID hit.
While playing under these market conditions, companies still have to forecast and plan their business in order to produce and ship the goods that consumers will eventually buy. To do this effectively, they need to understand demand patterns at the point-of-sale.
But we’ve found that in many cases, brands are not fully utilizing POS data to make their forecasts more accurate. With this guide, we’re hoping to provide a roadmap to changing that. Below, we’ve gathered some of the best practices from our customers who are using data in Alloy to plan and execute with greater accuracy.
Ch 1: Three Methods for incorporating out-of-stocks into your forecasts
Real-time point-of-sale (POS) data is a must for a good demand forecast. It’s a direct demand signal from the consumer that avoids the distortions and delays that retailer orders often introduce.
But even POS doesn’t always fully capture true demand as it only reflects what shoppers actually purchased. It doesn’t tell you what was desired, but not purchased because your product was not available. For example, when a great promo causes an item to go out-of-stock or products are perpetually understocked in certain stores, the actual demand for the product is most likely higher than what the sales numbers reflect.
If you don’t account for these out-of-stock events by adjusting the data set going into your models, they can’t learn from the mistake and you’re doomed to repeat it. Sales will be artificially depressed again because you only forecasted to sell, and thus only sourced, made and delivered, as much as you did before.
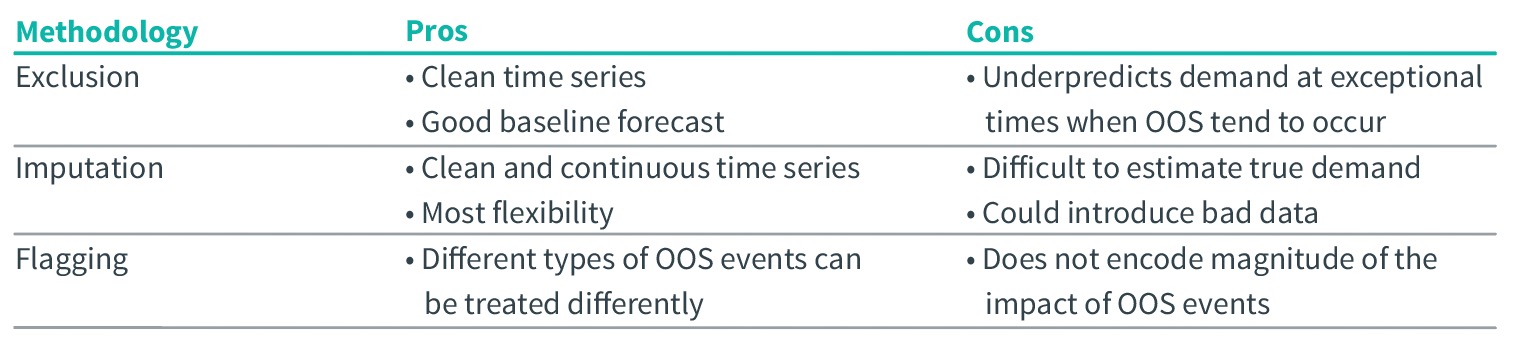
To break the cycle and get a head start preventing lost sales, you need to know when, where and what products had out-of-stocks. Then there are three main methods for adjusting the data to incorporate this input in your demand forecasts. There are pros and cons to each, but the important thing is to not simply ignore previous out-of-stock events when preparing your data.
Exclusion
As the name implies, exclusion basically deals with out-of-stocks by removing any affected data points from your time series. Since it completely deletes sales that would have been impacted by out-of-stocks, the result is a neat time series. It only contains data that is closer to true demand for use in forecasting. The “dirty” data points do not have the opportunity to bias the forecast because of uncaptured lost sales. The methodology is fairly straightforward and easy to implement unless you have extremely frequent out-of-stocks. However, out-of-stocks typically do not occur at random. For instance, they may be linked to certain stores, regions, or seasonal patterns where demand is higher than average. These patterns hold critical insights that, if effectively identified, could make a real difference in forecast accuracy, not to mention sales and marketing decisions. As a result, while exclusion will give you good baseline forecasts by keeping the data clean, it is likely to still underpredict sales during the business critical times when out-of-stocks tend to occur, such as promos or holidays.
Imputation
This method is another attempt at creating a clean time series, while avoiding the gaps left by exclusion. Instead, you make a concerted effort to fill those gaps by estimating (i.e., imputing) the true demand levels where there were out-of-stocks. You’re answering the question: “What would sales have been if there had been enough inventory on shelf to fully service demand?”The main problem with applying this method is its difficulty. There’s no way to know for sure what could have been. To create a close estimate, you need enough historical data from similar locations and events that don’t go out-of-stock to give a realistic idea of what true demand should be. Otherwise, they are just guesses with the sheer purpose of filling in the gaps, regardless of the accuracy. This process introduces bad data that could be misleading, and you wouldn’t even be able to determine whether you are over- or under-predicting true demand. If you are able to accurately estimate true demand, the advantages of imputation are great. You have a clean, continuous time series that gives you the most flexibility. You can easily apply different forecasting models and it can even be leveraged for other applications. Setting your team up for success goes back to the data again. The more granular (store and SKU-level) sell-through and out-of-stock data you can get, the more opportunities you have to directly compare similar locations and events and better estimate the imputed values when you have out-of-stocks.
Categorical Indicator Variable (Flagging)
The third way to incorporate out-of-stock events is to actually acknowledge it inside the forecast as a special event. The last two methods took out-of-stocks into account by adjusting the sales numbers of the time series; flagging is separate from the sales data and adds a categorical indicator variable that can go into the model formulation. Flagging allows you to categorize out-of-stocks, so you can treat different types of occurrences differently. For example, out-of-stocks caused by a retailer consistently under-ordering vs. one caused by a sudden weather event that impacted shipments, should not necessarily be treated the same way when forecasting demand. It also allows you to differentiate between when POS does reflect true demand (when there are no out-of-stocks) and when it does not. These strengths of flagging enrich your data set, but out-of-stocks can still only be incorporated at the broad categorical level, not quantitatively like with imputation. Flags are typically a discrete variable, so it is hard to also indicate the magnitude of impact each of these types of out-of-stock events has, particularly if they are one-off events. This nuance gets lost, so if it can be calculated, a more precise method could yield more accuracy.
Next, we discuss how to choose which methodology to use to incorporate out-of-stocks in your demand forecasts. Your industry, the type of forecasting model you’re using and data you have access to may all impact your decision.
"POS data is a direct demand signal from the consumer that avoids the distortions and delays that retailer orders often introduce."
Ch 2: How to choose the right method for incorporating out-of-stocks
When out-of-stocks occur, point-of-sale data, which is the basis for a good demand forecast, reflects lower demand than what consumers actually want to purchase. To keep from under-forecasting demand, you need to account for these events somehow in your data.
Here we’ll describe situations in which you should use each of the aforementioned methods. Your chosen approach impacts the data you need and forecasting models you can use, which we’ll discuss too.
Getting this data preparation right might seem like a lot of work, but it helps ensure you’re using the best demand signals to build forecasts. Solutions like Alloy can help, and it ultimately gives you a head start on preventing further short or late orders, out-of-stocks and lost sales.
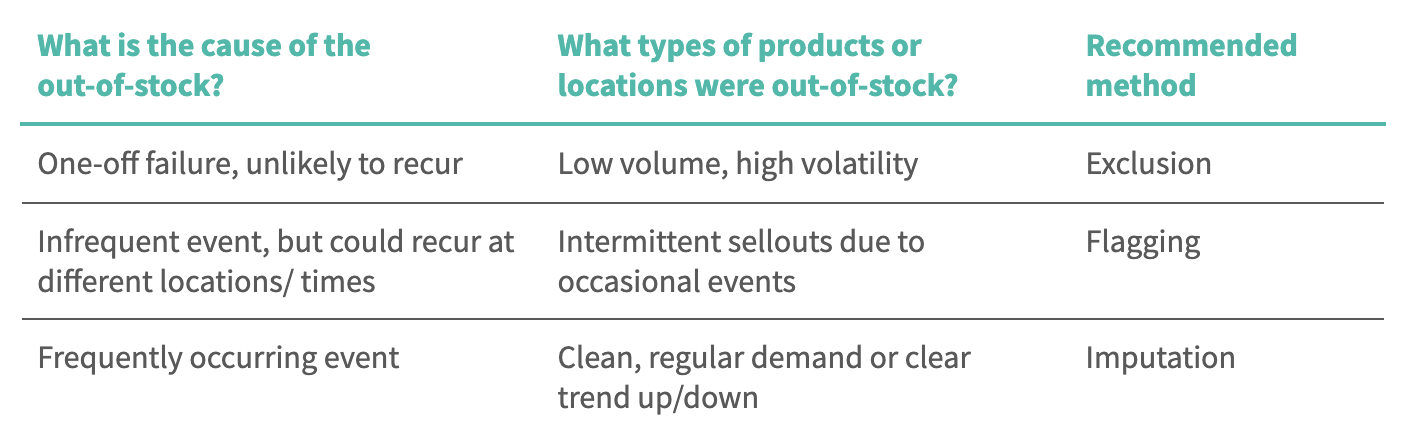
What is the cause of the out-of-stock?
One of the first questions you should ask yourself when deciding between methods is causation. The reasons behind an out-of-stock range widely, from insufficient coordination between manufacturers and retailers, to extraordinary and unexpected demand, to supply issues.
Consider some sample scenarios:
Say you had a one-time service disruption that caused a single late delivery and led to an out-of-stock. In this case, it’s reasonable to use exclusion and omit this event when developing your demand forecast. It doesn’t provide much insight, as long as it doesn’t happen more than once or twice.
On the other hand, maybe the out-of-stock was caused by an event that’s likely to occur again, like a great promo. It’s best to use flagging since it can indicate the root cause. You can then incorporate these exceptional situations into your sales data and simulate how they will affect your demand forecasts.
Now let’s say it wasn’t just a one-time disruption. Maybe shelves were empty due to consistently late delivery or another frequent cause. If demand is regular and predictable, then the best method to choose for forecasting is imputation. You can estimate what demand would have been using historical data from previous, similar situations when out-of-stocks did not occur and avoid gaps in the data.
Of course, a combination of scenarios could have caused your out-of-stocks. Ideally, you review each event separately and select the appropriate method for accounting for each one. Hybrid options combining multiple methods can also help balance out potential biases they each create.
What types of products or locations were out-of-stock?
You should also consider the actual products or locations in question because they impact how consumers react to the out-of-stock, and thus how important (and possible) it is to understand.
In general, imputation is ideal for products with regular demand, where it’s easy to track downward or upward sales trends.
Exclusion is the best option for low-volume products, such as new luxury items, and high volatility products, like non-tradable food. Because of the relative infrequency of out-of-stocks, it’s difficult to estimate their likely demand, and out-of-stocks are less valuable to understand more generally.
Flagging is applicable when out-of-stocks happen intermittently. Think of products or stores where demand is impacted by occasional events, like inclement weather or a local sporting event. With clear out-of-stock drivers, flags are useful for simulating future impact on demand when a similar event takes place.
After you’ve determined what method to use — exclusion, imputation, or flagging — you need to ensure you have the right data and forecasting models to support it. Best practice is to not let these factors determine how you account for out-of-stocks, and instead make your choice based on the characteristics of the out-of-stock, as we just described. You have options when it comes to getting the necessary data and building the forecast models, and it helps ensure your forecast reflects as close to true demand as possible.
Imputation: the most flexibility
If you’ve determined imputation is the right approach, your options are pretty open. It only requires aggregate sales data. As long as you have enough history, you can still make a good estimate of what true demand would be at all times. More granular data enables you to use similar locations and events to increase accuracy, but is not mandatory.
In addition, imputation leaves you with a clean, continuous time series. That gives you a lot of flexibility to apply different forecasting methodologies. The three primary classes of modeling methodologies – historical average, time series with added regressors and machine learning – can all work.
Exclusion: the most restrictive
In contrast, because exclusion creates gaps in the data, you need to be very careful when using it. You should pinpoint specific out-of-stock events that are one-time anomalies to exclude, so it requires very granular store/SKU/day data. If the data is at a higher level, you could be inadvertently excluding good data from your input.
Furthermore, some historical average models, like exponential smoothing, don’t behave well with any data gaps and so cannot be used with exclusion. Similarly, time series models typically like repeatability (e.g. seasonality, last week/last year comparisons) to identify patterns. If you’re excluding a lot, it could cause sparsity in places where you are missing the reference data and limit the models you can use. Machine learning methods can still work, but generally the more data you have to feed into them the better, so exclusion is not ideal.
Flagging: somewhere in between
Like exclusion, flagging requires granular sales data so you can add the right categorical indicator variable to each out-of-stock occurrence; otherwise, you have to know what fraction of locations or products were out-of-stock. However, if you only have aggregate sales data, there may be ways to intelligently fill in the gaps and get to more granular data for the purpose of flagging.
In terms of forecasting models, flagging works well with both time series with added regressors and machine learning models. For example, seasonal ARIMAX models, which compare different historical time periods and take additional factors into account, can easily make use of the out-of-stock flag. Machine learning systems can easily incorporate flagged data into their models too. Some of the flagged events could cause a downward bias in the overall estimate and in this case, combining flagging with imputation can help correct for it.
There’s a lot to consider with out-of-stocks and how to clean up the data mess it creates. To account for important variables like root cause, product and location, data requirements and forecasting models, your first step should be investing in a best-in-class forecasting process to improve your forecasts. Then your team will be in a stronger position to focus on managing by exception, catching when actuals deviate significantly from your demand plan and making the right adjustments.
Ch 3: The role of seasonality in demand forecasting
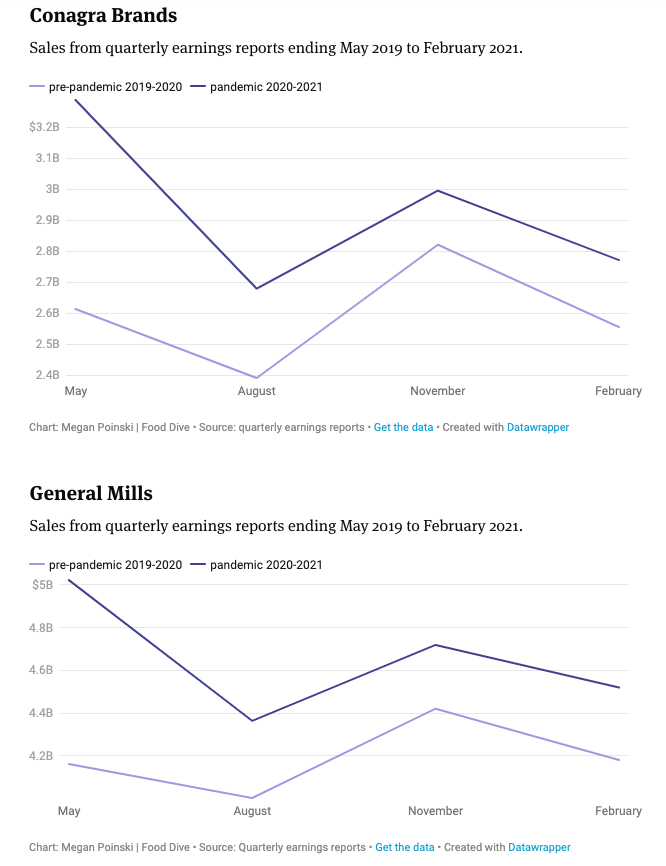
Seasonality is incredibly persistent. Even through the tumult of 2020 – waves of Covid-19, lockdowns, re-openings, etc. – seasonal trends seemed to remain intact.
These charts comparing earnings at publicly traded food companies during the four most recent quarters to the same quarters a year before show the general pattern of sales over the course of the year tended to stay the same. The lines are shifted up or down, but their shapes mostly hold.
So it’s logical seasonality is at the heart of a baseline demand forecast. You can count on it, even though reality will deviate (sometimes quite significantly!) from plan. It provides useful insight into how sales will vary over a given period of time.
What’s more, understanding seasonality for each of your products can give you a head start in demand planning. With a good grasp of how much consumer demand varies, you can select the right demand forecasting models, focus on making plan adjustments and spot true outliers that require further attention.
In this chapter, we’ll examine how to detect seasonality and methodologies to account for it in your demand forecast, while keeping an open mind about whether seasonality is truly at play.
Seasonality types
There are three common seasonality types: yearly, monthly and weekly.
Yearly seasonality encompasses predictable changes in demand month over month and are consistent on an annual basis. For example, demand for swimsuits and sunscreen in the summer and notebooks and pens leading up to the new school year.
Monthly seasonality covers variations in demand over the course of a month, like the purchasing of items biweekly when paychecks come in or at the end of the month when there’s extra money in the budget.
Weekly seasonality is a characteristic of more general product consumption and reflects a host of variables. You may find that consumers buy more (or less) of different products on different days of the week.
A product can exhibit none, one, two or all three types. Because purchases can vary down to the day of the week, it’s important to have daily demand data to build your forecasts and plans. Execution teams will use them to make daily decisions about shipments and collaborate with customers to align replenishment.
Detecting seasonality
You probably have a general sense of your product’s seasonality, but turning it into useful input for forecast requires data. Specifically, store point-of-sale (POS) and e-commerce sales. Customer orders are not a good reflection of true consumer demand, nor for detecting seasonality, because retailers muddy the waters with their ordering algorithms and decisions to stock up or wind down inventory for different reasons.
To check if a specific time series exhibits seasonality, you can perform hypothesis testing on it. Another option is to take a more empirical approach and check whether models with or without a seasonal factor are more representative of your data using a measure like the Akaike information criterion.
Seasonality will typically vary from region to region, depending on local calendars and weather. You may need to segment your data geographically to identify seasonality patterns. At the same time, aggregating forecasts to a less granular level—product category instead of product, for example—may make it easier to distinguish seasonal patterns from random noise.
Modeling methodologies
Most forecasting methodologies allow for explicit modeling of a seasonal term. SARIMA (ARIMA with seasonality) allows for forecasts based solely on the past values of the forecast variable. The Holt-Winters seasonal method comprises a forecast equation and three smoothing components for the level, trend and seasonal components.
But beware of their limitations and additional accommodations you may need to make depending on the model you select. Some models don’t allow for multiple seasonality, like both weekly and yearly. If you’re using one of these, you have a few options depending on the nature of your data:
Choose to include only the most critical type of seasonality
Then there are some models that assume integer seasonality. That’s problematic when there are 365.25 days in a 12-month period due to leap years, and the length of a month fluctuates throughout the year.
What’s more, some seasonal events aren’t tied to a calendar date (Lunar New Year, Thanksgiving, etc.), so a seasonal term isn’t the best way to account for them. Instead, you could model them as binary regressors using holiday calendars.
Seasonality alternatives
Watch out for times that basic seasonality is not actually the most relevant factor in the forecast. It may just be covering up the true underlying driver. As a result, you would be better off incorporating the regressor variables in the model instead.
For example, purchases of antifreeze have a more direct relationship with the temperature than the precise time of year, as weather patterns waver on an annual basis. With that in mind, using temperature as a regressor variable, instead of modeling seasonality, would generate better short-term forecasts. However, for longer-term forecasts, seasonality would still be an easier way forward. It’s much harder to get accurate weather forecasts on longer timescales.
Meeting the seasonality challenge
Once you have a solid baseline forecast, your seasonality picture will become much clearer, so it’s worth the investment to get it right. A good rule of thumb: Go back as many years as possible in order to pinpoint reliable seasonality patterns. When it comes to newer products or product categories, you may need to extract those patterns from similar products or by leveraging syndicated market data.
Then you can focus on the next step for a best-in-class demand forecasting process, making the appropriate forecast adjustments to account for coming events and product dynamics. It’s where the most variability can occur, and so where your demand planners should spend more of their time.
Ch 4: Forecasting and planning for business-critical events
The 80/20 effect is particularly salient in consumer goods. Depending on your industry, yearly revenue can be determined by weather or holiday-driven selling seasons, a few key promotions, big product launches or unexpected consumer trends.
Because of their outsized impact, these business critical times are the best opportunity for you to drive change and create an outsized impact on your company. You can rally colleagues across sales, marketing, supply chain planning and finance around them, and more easily break down silos that normally get in the way.
It’s still a tall task, but cross-functional analytics can help align teams both leading up to and during high-stakes events. Leveraging a shared source of truth, you can target the most common sources of planning and execution errors to ensure that peak consumer demand turns into dollars.
Forecasting and preparing for business critical events
Take advantage of all relevant data to help get inventory pre-loaded in the right amounts at the right places before events that drive most of your sales.
#1 – Use historical POS and retail inventory data to create forecast baselines
When you create forecasts only using orders or shipments from last year, you fail to account for some of the most significant sources of error. Crucial details that help provide more accurate baselines get washed out. Ensure planners have access to POS data in a usable format for forecasting to improve planning and keep it aligned to execution.
#2 – Forecast unconstrained demand by accounting for out-of-stocks
Failing to account for demand that may have existed when you were out-of-stock creates an artificial, negative feedback loop. It leads to under-forecasting and ultimately, more lost sales. To avoid propagating the problem, your forecasts should use an estimation of unconstrained demand. Incorporate out-of-stocks to model what people would have bought if you were on the shelf all the time, not what they actually bought.
#3 – Model event forecasts based on similar historical events
Using A/B analysis to scientifically measure the impact of events will significantly improve your forecast accuracy for similar future events. You can then apply the relevant event lift to your POS baseline. Build your product launch curves based on similar product launches in the past. Measure the sales lift from historical promotions using test & learn to more accurately forecast the lift from planned promotions.
#4 – Work with your retailer to correct for historical allocation mistakes
You can also learn from past events how demand was distributed geographically and how well your retailers aligned inventory accordingly. Especially during short selling seasons, big promotions and product launches, you can’t assume they correctly allocate inventory within their network at the start or will replenish stores effectively. Identify DCs and stores that were significantly under or overstocked before to avoid the same issues in your coming event.
#5 – Continually track your internal forecasts against your retailers’ forecasts
Retailers have to forecast every single product they carry, so why assume they do a better job than your team? Depending on your relationship, you may be able to influence their forecasts if you notice them deviating significantly from yours. Even if not, you have to prepare to meet retailer orders. Helping everyone internally understand how forecasts compare will preempt countless headaches. It can also facilitate an open dialogue with your buyer around forecasting to further build trust.
Ch 5: Alloy Planning: POS-driven forecasting, purpose-built for consumer brands
Alloy Planning helps consumer goods companies adapt quickly to changing market and supply chain conditions, break down silos between teams and empower planners to focus on maximizing business opportunities.
With Alloy Planning, consumer goods brands can:
Sense and adjust quickly to market changes to reduce unnecessary stockouts and minimize excess inventory costs
Build trust across teams by connecting them to a single source of information
Maximize planner impact by freeing up planners to manage by exception and focus on the highest impact areas
Logan Ensign is Chief Customer Officer at Alloy.ai. Logan — an expert in predictive analytics, AI and supply chain — works closely with leading consumer brands to help them solve their retail, ecommerce and supply chain data challenges in a way that helps them achieve their business objectives. Logan joined Alloy.ai from InsideSales.com, an AI and predictive analytics company focused on transforming sales operations.
Defining demand sensing, how it differs from planning and 4 reasons for building out demand sensing in conjunction with your demand planning capabilities