- Manfred Reiche
Most brands know that data can be a competitive differentiator when it comes to building retailer relationships and efficiently serving consumers. From providing insights on buying trends to helping with supply chain management, point-of-sale data and analytics can make the difference between growing shelf space or losing it, or a successful product launch and a mediocre one.
That’s why Alloy.ai is focused on helping consumer goods brands gather and make use of retail data, and here on our blog, we’re sharing our learnings from working with the data of different retailers. We compared Amazon Retail Analytics Basic (ARA Basic) and Amazon Retail Analytics Premium (ARA Premium), and today we’re examining The Home Depot.
The Home Depot has been investing a lot in enabling its vendors through more data, better tools, and enhanced support. Activity includes the acquisition of Askuity, rollout of a Supplier Analytics Program, and a new Supplier Concierge Service for escalations. It’s part of a larger industry trend we observed at this year’s Gartner Supply Chain Executive Conference of retailers wanting suppliers to help them make better decisions.
It’s great to see the investment, but it’s also been causing confusion. We work with a number of brands that sell-through The Home Depot, and have been in touch with The Home Depot ourselves to better understand the changes they’re making. To help make things clearer for everyone, we’ll share here our experience with the various options for receiving point-of-sale and inventory data from The Home Depot. As we learn more or The Home Depot makes changes, we’ll try to keep it updated. And if you’ve had a different experience, please let us know!
First, it’s important to differentiate between the options for data types shared by The Home Depot, vs. the options for tools that The Home Depot makes available to access that data. There are just two levels of data types: VendorDrill Standard, which includes only basic metrics, and the Supplier Analytics Program, which includes a more robust set of metrics.
However, there are a number of options to access the data made available with the Supplier Analytics Program, including VendorDrill+, DataConnection, and Askuity. Note that these options are not mutually exclusive, nor dependent on each other. For example, a supplier can use both Askuity and VendorDrill+, or choose to just access the data via DataConnection and not sign up for Askuity.
Outside of these tools, EDI (electronic data interchange) is also an option for receiving the data, like with many other major retailers and types of data. In fact, for operations in some countries, like The Home Depot Canada, it’s the only way for brands to get the data today. Receiving EDI requires using an EDI service provider, like True Commerce. If you don’t already have one, you would need to on-board a provider for it, but if you do, it can be a seamless way to receive the data in a standardized format.
Data types
Through the Supplier Analytics Program, Home Depot vendors have access to all of the key metrics you would expect from a retailer: unit sales, dollar sales, units on hand, out-of-stocks. This data is available at the day- and store-level for granular demand analysis, and updated on a daily basis. Plus, you can access up to three years of historical data.
The program also makes other metrics available, like fill rate, fulfillment channel, online sales funnel, and planogram data that can help you better understand consumer demand drivers and manage your omni-channel business. The Home Depot further promises to release more metrics on a regular basis.
Vendors who are not invested in the Supplier Analytics Program receive only the basic metrics like sales, inventory on hand, and out-of-stocks. These are shared through VendorDrill Standard, an Excel-based solution for downloading data and building reports.
Tools
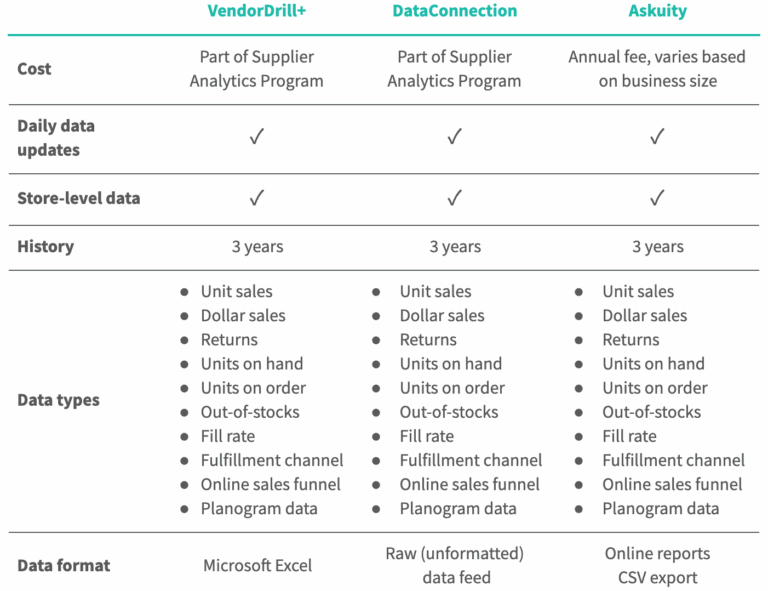
The three primary tools offered by The Home Depot to access the more robust set of metrics included in the Supplier Analytics Program are: VendorDrill+, Data Connection, and Askuity. Each of these provides the same set of data, but in a different format for use.
- VendorDrill+. Similar to VendorDrill Standard, VendorDrill+ is an online portal where users can log in to build reports and download the data for analysis in other tools. It provides your data in a simple Excel template, and is designed for Excel savvy users.
- DataConnection. The Direct DataConnection provides a raw data feed, which can be easily integrated into different business intelligence (BI) tools or platforms for use. The system-to-system solution provides a powerful and automated connection, and can be customized to align with the unique needs of your business.
- Askuity. Askuity is a data visualization and analytics tool that helps brands turn complex retail data into insights. It offers built-in dashboards, trend and performance reporting, regional heat maps, and drill-down functionality. Because it presents the data to you in an easy-to-understand format, it is a starting point for anyone in your company to get a better understanding of your Home Depot business. However, there is an annual fee for access, which we’ve heard ranges widely.
As you can see below, the main differences between the three are what format the data is provided in, and thus what additional tools you may need to be able to make use of the retailer data, and the associated cost.
Summary of VendorDrill+ vs. DataConnection vs. Askuity

Weighing the differences
When it comes to which tool option or options are right for you, there are a few key questions you should consider to make an informed decision.
How much of my business is done through The Home Depot?
If you only sell through The Home Depot, or it represents the vast majority of your business, then Home Depot-specific tools like Askuity and VendorDrill+ might make sense for you. However, if your business is more balanced, and there are other retailers or e-commerce channels that are important to your brand, the DataConnection is likely a better alternative. It would enable you to integrate The Home Depot data with your data from other retailers, so you can understand how your business is doing as a whole and gain insights by comparing retailers or observing trends across all retailers.
Is the time your team would spend manually downloading and manipulating the data, perhaps combining it with data from other retailers, the best use of their talents?
Even if you are only selling through The Home Depot, DataConnection is very valuable if you can integrate the data with data from your own systems, such as your ERP. It would enable you to better match up units on order with your transaction history, or more easily utilize the data for demand forecasting, for example.
What tools do we already have in place?
If you already have a tool for point-of-sale analytics, like Alloy.ai, or a business intelligence tool that your team is comfortable with, continuing to use it will likely be the easiest path. You can still access a robust set of data through the DataConnection tool, and don’t have to worry about evaluating and learning a new tool or any change management. The Home Depot provides clear documentation that makes it easy to set up the DataConnection.
If you don’t already have a solution for point-of-sale analytics, VendorDrill+ or Askuity may meet your needs, depending on your answer to the first question. Many companies find value in a retail analytics tool to help them make data-driven decisions and grow sales, and we always encourage brands to look into all their options for it.
What is the total cost of ownership (TCO) and what are the tradeoffs?
Here’s where things can get a bit more complex.
If you purchase Askuity, there is, of course, a cost associated with it, and it will only really meet your needs for The Home Depot. If you’re interested in analyzing the rest of your business with the same level of detail and insight, you may then want to bring on an additional data or analytics solution for your e-commerce channels and other retailers. That’s another additional cost. From both a total cost and ease of use standpoint, it’s hard to justify having two platforms instead of consolidating everything on just one tool.
On the other hand, while there is no added cost for VendorDrill+ and Excel is a tool you would have regardless, the results you get from it may not be the same or require much more effort to achieve. Is the time your team would spend manually downloading and manipulating the data, perhaps combining it with data from other retailers, the best use of their talents? Could they do it at the scale and granularity that an automated tool could, and generate the same level and number of insights to help grow the business? The TCO is low, but the tradeoff could be slower growth, or worse, losing market share and shelf space to brands that are investing more in data and analytics.
Finally, with DataConnection, there is also no additional cost, but it can only be used with a BI tool or retail analytics platform. If your company licenses a general purpose BI tool, like Tableau, the incremental cost on a per user basis might be small, but the same tradeoff exists. You won’t get the same value out of it compared to a purpose-built tool for manufacturers to manage their sales and supply chain, or only with a lot of work to configure, maintain, and extract actionable insights from it.
The cost of retail analytics platforms varies depending on the vendor, and even there, it’s important to consider the amount of resources it will take to get set up, customize it to your business, and address any changes or issues that come up as you use it. These are all part of the TCO and time-to-value factors to take into account when deciding which option to go with.
Looking around
You may be surprised by what you discover once you start digging into solutions for retail analytics. If you liked what you saw with Askuity, Alloy.ai software offers the same level of analytics, plus automatic integration of data from all your major partners, more intuitive dashboards, seamless workflows, and support that’s been called “world-class.” In fact, Askuity customers were switching to Alloy.ai even before the company was acquired by The Home Depot.
If you’d like to see a demo, let’s start a conversation.

Manfred Reiche
Manfred Reiche is Alloy.ai‘s subject matter expert on all things related to retail data and products. He spent his time at Alloy.ai being hands-on with some of our most sophisticated brands in the consumer goods industry. Prior to joining us at Alloy.ai, Manfred started his career as a technical consultant at Deloitte, focused on SAP implementations.


