Products
A purpose-built consumer goods platform for modern commerce.
The execution suite specifically designed for real-time response.
High-definition intelligence for the commerce ecosystem.
AI Tools
Your 24/7 digital workforce for sensing and responding to demand.
Put your retail replenishment orders on autopilot to capture every sale.
Put your performance reporting on autopilot and reclaim 100+ hours.
Data Sources
Automatically capture granular POS and inventory data from 450+ partners.
Sync inventory across partner networks and your own to eliminate blind spots.
Connect internal production with the retail shelf to bridge the execution gap.
Data Destinations
Pipe commerce-ready, harmonized data directly into your existing tech stack.
Power your BI tools with daily, SKU-location signals from every retail partner.
Drive planning with actual POS data to align your supply with the retail shelf.
Use Cases
End the manual downloads with a trusted, granular source of commerce truth.
Stop the data mining and get root-cause answers across every partner instantly.
Sense demand shifts at the SKU-location level to align supply with the shelf.
Respond to real-time market changes to prevent stockouts and protect margins.
Beat your sales plan by acting on insights with improved collaborative replenishment.
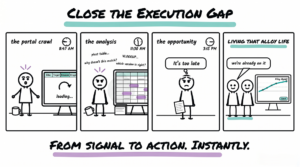
Empower Sales and Supply Chain teams to move from signal to action, instantly.
Purpose-built commerce intelligence for any consumer goods category.
Topics
Expert guides to navigating retailer portals and winning at the shelf.
Strategies to sense demand surges and capture every possible revenue signal.
How to respond to disruptions in real-time and reduce out-of-stocks.
Deep dives into turning fragmented retail data into a trusted, granular truth.
Analysis of changes and shifts in the modern consumer goods industry.
Guides & Resources
The executive’s library for closing the execution gap and driving growth.
Masterclasses in retail partnerships, supply chain agility, and sales growth.
A technical toolkit of demo videos, walkthroughs, and success frameworks.
Podcast
Conversations with industry experts on the future of commerce intelligence.
Company
Closing the gap between demand signals and revenue for consumer brands.
How leading brands use real-time response to capture revenue and drive growth.
Collaborate with an ecosystem of experts moving the future of commerce.
The latest on our products, partnerships, and the commerce intelligence category.
Talk to an expert about sensing demand shifts and automating your response.